
How to Calculate ROI in Power BI
Return on Investment (ROI) is one of the most useful financial metrics for understanding how effectively an investment generates profit. In this tutorial, we will build a simple ROI analysis in Power BI using project-level Revenue and Investment data, calculate Net Profit, and then calculate ROI dynamically using DAX. The example contains five projects: Project A, B, C, D, and E.
What is ROI?
The basic ROI formula is:
ROI=(Net Profit/ Cost of investment)×100
Where:
Net Profit = Total Revenue − Total Investment
For example, if a project generates Rs 12,500 in revenue and requires Rs 10,000 of investment:
[Net\ Profit = 12,500 – 10,000 = 2,500]
Therefore:
[ROI = \frac{2,500}{10,000} \times 100 = 25%]
So the project generated a 25% return on the investment.
Step 1: Create the ROI Data Table
For this example, we use the following data:
| Project | Total Revenue | Total Investment |
|---|---|---|
| Project A | Rs 12,500 | Rs 10,000 |
| Project B | Rs 24,000 | Rs 20,000 |
| Project C | Rs 6,500 | Rs 5,000 |
| Project D | Rs 18,000 | Rs 15,000 |
| Project E | Rs 10,000 | Rs 8,000 |
You can enter this data into Power BI using Home → Enter Data.
Alternatively, you can create the table directly using DAX.
Go to:
Modeling → New Table
and use:
ROI Data =
DATATABLE(
    "Project", STRING,
    "Total Revenue", CURRENCY,
    "Total Investment", CURRENCY,
    {
        {"Project A", 12500, 10000},
        {"Project B", 24000, 20000},
        {"Project C", 6500, 5000},
        {"Project D", 18000, 15000},
        {"Project E", 10000, 8000}
    }
)
Step 2: Calculate Total Revenue
Create a new measure:
Total Revenue =
SUM('ROI Data'[Total Revenue])
This measure will dynamically calculate revenue according to the current filter context.
For example, when Project A is selected:
Total Revenue = Rs 12,500
Step 3: Calculate Total Investment
Create another measure:
Total Investment =
SUM('ROI Data'[Total Investment])
For Project A:
Total Investment = Rs 10,000
Step 4: Calculate Net Profit
Now we can calculate profit using Revenue minus Investment:
Net Profit =
[Total Revenue] - [Total Investment]
For Project A:
Rs 12,500 − Rs 10,000 = Rs 2,500Step 5: Calculate ROI
Now comes the main calculation.
Create a new measure:
ROI % =
DIVIDE(
    [Net Profit],
    [Total Investment],
    0
)
Then select the ROI % measure and change its format to:
Percentage
with two decimal places.
Why use DIVIDE instead of /?
Using DIVIDE() is recommended in Power BI because it safely handles situations where the investment is zero or blank.
The third argument:
0tells Power BI what to return if the denominator is zero.
Final Result
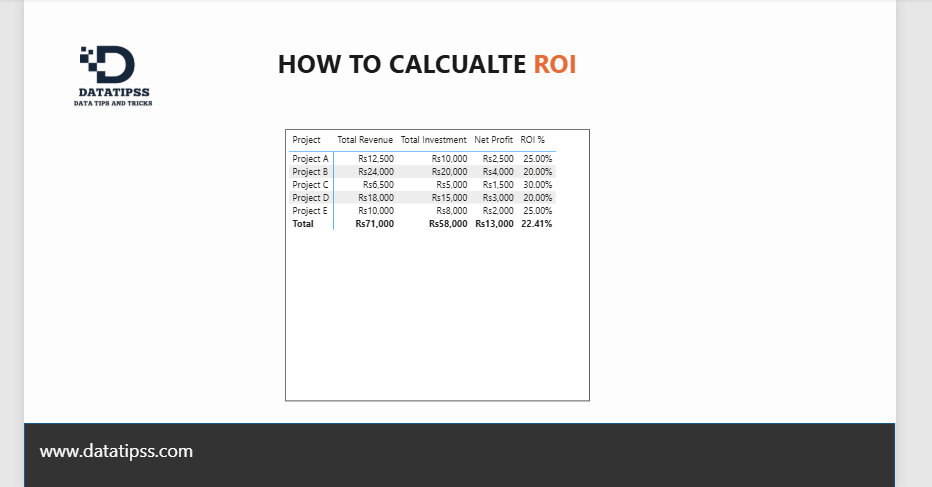
Your Power BI table can look like this:
| Project | Total Revenue | Total Investment | Net Profit | ROI % |
|---|---|---|---|---|
| Project A | Rs 12,500 | Rs 10,000 | Rs 2,500 | 25.00% |
| Project B | Rs 24,000 | Rs 20,000 | Rs 4,000 | 20.00% |
| Project C | Rs 6,500 | Rs 5,000 | Rs 1,500 | 30.00% |
| Project D | Rs 18,000 | Rs 15,000 | Rs 3,000 | 20.00% |
| Project E | Rs 10,000 | Rs 8,000 | Rs 2,000 | 25.00% |
| Total | Rs 71,000 | Rs 58,000 | Rs 13,000 | 22.41% |
An important point about the Total ROI
Notice that the total ROI is 22.41%, not simply the average of the five project ROI percentages.
Power BI calculates the total using:
[
\frac{13,000}{58,000}\times100 = 22.41%
]
This is the correct approach because the overall ROI should be based on total profit divided by total investment.
The Complete DAX
For this example, the complete set of measures is:
Total Revenue
Total Revenue =
SUM('ROI Data'[Total Revenue])
Total Investment
Total Investment =
SUM('ROI Data'[Total Investment])
Net Profit
Net Profit =
[Total Revenue] - [Total Investment]
ROI %
ROI % =
DIVIDE(
    [Net Profit],
    [Total Investment],
    0
)
That’s all you need to create a basic dynamic ROI calculation in Power BI.
Why use Measures for ROI?
Using measures instead of calculated columns gives you a much more powerful analysis.
For example, you can add:
- Project
- Department
- Product
- Customer
- Region
- Month
- Year
- Investment Type
to your report and the ROI measure will automatically recalculate according to the selected filter context.
For example:
Region → Pakistan
Project → Project A
Year → 2026
Power BI will calculate the ROI for exactly that selection.
Building an ROI Dashboard
Once the basic calculation is working, you can turn it into a complete ROI dashboard with:
KPI Cards
- Total Investment
- Total Revenue
- Net Profit
- ROI %
Charts
- ROI by Project
- Investment vs Revenue
- Profit by Project
- ROI Trend by Month
Filters
- Project
- Year
- Department
- Region
- Investment Type
This allows management to quickly identify which investments are generating the highest returns and which projects may require attention.
Final Takeaway
ROI is fundamentally a measure of how much profit was generated relative to the investment required to generate it.
The basic Power BI logic is:
Revenue
   ↓
Investment
   ↓
Net Profit = Revenue − Investment
   ↓
ROI = Net Profit ÷ Investment
And in DAX:
ROI % =
DIVIDE(
    [Net Profit],
    [Total Investment],
    0
)
This simple measure can then become the foundation for a much more advanced ROI and Investment Performance Dashboard in Power BI.
Hashtags
#PowerBI #DAX #PowerBIDAX #BusinessIntelligence #DataAnalytics #DataVisualization #ROI #ReturnOnInvestment #FinancialAnalysis #FinanceDashboard #PowerBIDashboard #MicrosoftPowerBI #Analytics #DataTips #DataTipsAndTricks #BusinessAnalytics #FinancialDashboard #BI #DataAnalyst #PowerBICommunity