
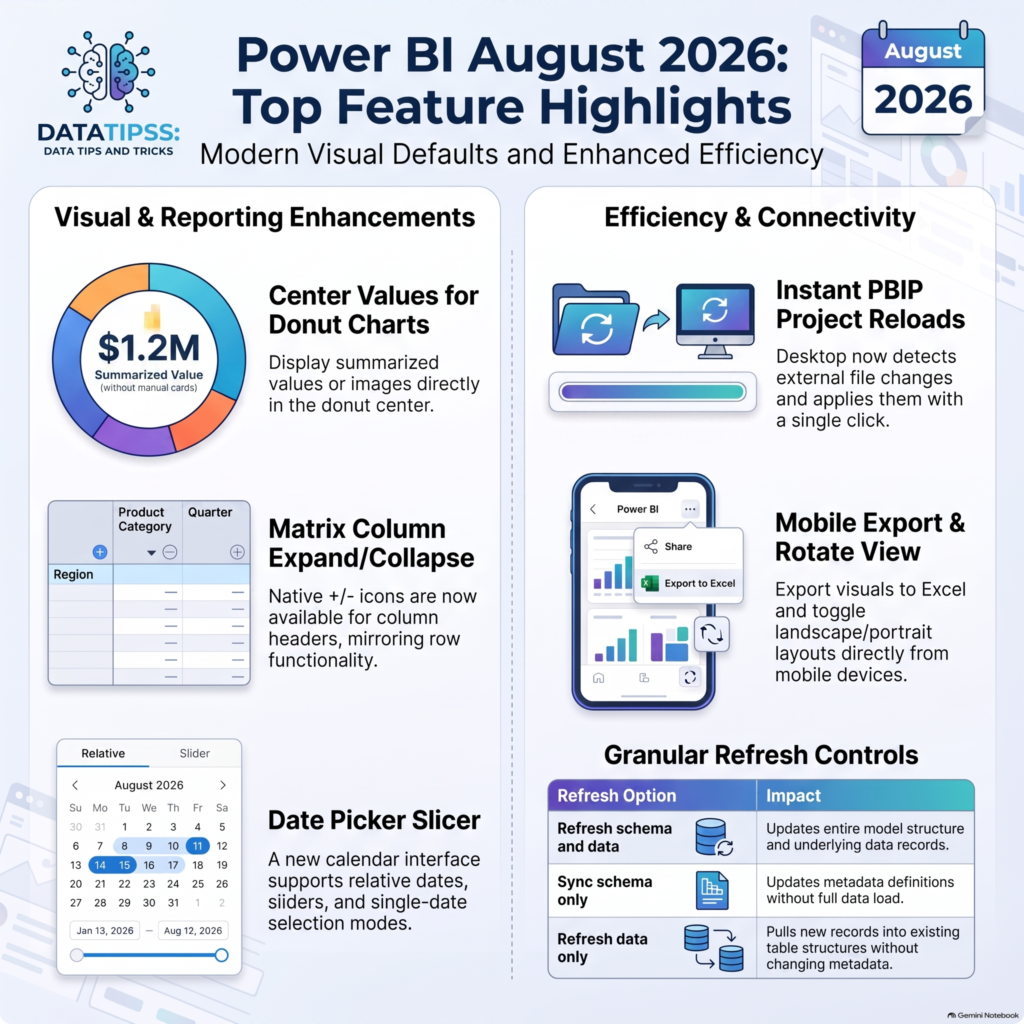
The August 2026 update for Power BI (Version: 2.157.879.0, published August 19, 2026) marks a significant milestone in the shift toward “agentic analytics.” This isn’t just about incremental features; it’s about a fundamental evolution in how we interact with our data environment. From granular modeling controls to the opening of local development sessions via the new Desktop Bridge, Microsoft is clearly focused on reducing developer friction and deep-seating Power BI within the Microsoft Fabric ecosystem.
Top Reporting Enhancements: The Modern Visual Experience
The New Donut Chart Center Value (Generally Available)
Microsoft has finally killed the “card-overlay” hack, bringing a native solution to one of Power BI’s most persistent formatting pain points. For years, we’ve relied on floating card visuals over donuts to display total values—a practice that was fragile and difficult to maintain.
Before vs. After: The Alignment Revolution
- Before: Authors manually layered a card visual over the donut. This created “z-order” nightmares where the card would accidentally hide behind the donut during selection. Alignment was never truly stable, often “drifting” when resizing or viewing on mobile.
- After: The center value is now a native property of the donut visual. It is anchored to the visual’s core, handling multi-line text and images simultaneously while remaining perfectly centralized regardless of filtering or drill-down.
- Customization: You can now configure background/font properties, “show blank” behavior, and specific decimal settings directly in the formatting pane. You can even insert images—like a revenue icon—with adjustable transparency to create truly professional-grade visuals.
Date Picker for Slicer Visual (Generally Available)
The slicer visual receives a massive usability boost. The new Date Picker is now GA, offering:
- Relative Selections: You can now define default date ranges that automatically roll forward as time progresses.
- Granular UI Controls: Support for traditional calendar flyouts and sliders.
- Selection Logic: A new “Single date” setting under selection controls restricts users to a specific point-in-time analysis, eliminating “range confusion” for end-users.
Matrix Visual Power-Ups
The Matrix visual remains the workhorse of enterprise reporting, and this month it gets two critical formatting upgrades:
- Customizable Column +/- Icons: Much like row headers, column headers now support expand/collapse icons. Crucially, these icons are fully customizable in terms of color and size within the formatting pane, allowing them to align with your corporate branding.
- Default Freeze State: You can now set a default freeze state for row headers (Format Pane > Layout > Freeze). This ensures the row headers stay pinned for all users by default, rather than requiring them to manually right-click during every session.
Standardizing Design: Modern Visual Defaults & Theming
Power BI is standardizing on the Fluent 2 base theme for all new reports. This isn’t just a skin; it’s a move toward a more consistent, accessible design language.
The Theme Pane is now Generally Available, allowing for report-wide control over color palettes, text styles, and visual properties. A key change to note: Font overrides have been removed from the base theme. This effectively makes the “Text” section of the theme a global override, ensuring that your branding choices are applied consistently across all visuals without the UI “fighting” your custom settings.
Advanced Modeling: Granular Control and Code-First Workflows
Strategic Semantic Model Refresh
Refreshing a model is no longer an “all or nothing” operation. In the Power BI Service, we now have surgical control over what gets updated, which is critical for large-scale enterprise models.
| Refresh Option | Technical Impact |
| Refresh schema and data | A full update of both the model structure and all underlying records. |
| Sync schema only | Updates model metadata without the overhead of pulling new data—perfect for fast structural changes. |
| Sync data only | Pulls new records based on the existing, locked schema. |
MVP Insight: These operations can now be performed at the table level, allowing for significantly more efficient refresh strategies.
TMDL View on the Web
The Tabular Model Definition Language (TMDL) view in the browser is a game-changer for CI/CD and maintenance. This enables emergency hot-patching of model metadata without the risky “download-edit-republish” cycle that often leads to version desynchronization. You can now script partitions or modify calendar tables directly in the browser with full IntelliSense support.
Connectivity and Accessibility: OneLake & Dark Mode
Power Query UI Improvements
The Power Query experience has been refined for accessibility. Specifically, connector icons with transparent backgrounds now receive an automatic white background in Dark Mode, ensuring visibility regardless of your UI theme.
OneLake Integration
OneLake image URLs are now fully supported. Power BI authenticates on the viewer’s behalf, allowing you to use OneLake-hosted files as dynamic sources for:
- Standard visuals (Image, Card, Table/Matrix cells).
- Button and List slicers.
- Reference layer maps and shape map files, which is a massive win for geographic analysts who want to centralize their spatial assets in Fabric.
Mobile & Embedded Analytics Updates
- Mobile “Rotate View”: A new button in the mobile footer (iOS/Android) allows users to toggle between portrait and landscape layouts, bypassing phone orientation locks.
- Mobile Data Portability: Users can now export data to Excel directly from report visuals within the mobile app, with all current filters and Row-Level Security (RLS) fully enforced.
- SharePoint Online Embedding: A revamped UI allows users to browse workspaces and reports directly. Additionally, a new toggle allows you to embed single visuals rather than entire pages, enabling more focused SharePoint dashboards.
The Developer’s Edge: PBIP & Desktop Bridge
PBIP & VS Code Integration
The Power BI Project (PBIP) workflow is now significantly faster. Power BI Desktop detects external changes to project files made by tools like VS Code and prompts for an “instant reload.” This effectively eliminates the wall between external code editors and the Desktop UI.
Power BI Desktop Bridge (Preview)
The Bridge is a lightweight local server that allows external applications and agents to interact with a running Power BI Desktop session via secure local APIs. This is the cornerstone of “Agentic Analytics.”
Core CLI Commands:
# Query the menu of available capabilities in your version
powerbi-desktop manifest

# Check which Desktop instances are currently running and their status
powerbi-desktop status

# Reload on-disk changes instantly without restarting Desktop
powerbi-desktop reload

# Programmatically capture PNG snapshots of every report page
powerbi-desktop screenshot-all
AI & Copilot: Evolving Permissions
- Permission Shift: By the end of August, Fabric App consumers only require “Read” permission on underlying semantic models (previously “Build”). This significantly simplifies the deployment of AI-driven apps across the enterprise.
- Copilot Visibility: Copilot Summary and Narrative visuals can now “see” visuals hidden behind display-only report bookmarks, ensuring AI summaries are accurate even in reports with complex, layered navigation.
Conclusion and Resource Links
The August 2026 update solidifies Power BI’s trajectory. We are moving away from a closed, manual reporting tool toward an open, scriptable analytics platform. The Desktop Bridge and TMDL Web View are not just for developers—they are the physical enablements that allow AI agents to assist in the authoring and validation of our data stories.
Next Steps:
- Download the latest Power BI Desktop: PBIDesktopSetup_x64.exe (661.7 MB).
- Verify Version Compliance: Ensure your organization is off versions from March 2026 or earlier before the October deprecation of the old file picker experience.
- Audit Your Refresh Logic: Explore the new table-level refresh options to optimize your Power BI Service performance.
Stay data-driven, The datatipss.com Team