
Intro (TL;DR)
I built a modern Healthcare Analytics dashboard (public healthcare data) using Power BI for visuals and Figma for background design. In this post I’ll show exactly how I prepared the data, built the report, styled the UI in Figma, exported two image variants (with and without background), and produced a mockup for sharing. If you want the full PBIX file, comment PBIX on my LinkedIn post and I’ll send it.
1) What I used
Power BI Desktop (latest stable)
Figma (for background & assets)
Public healthcare dataset (you can use any CSV / public API)
Optional: image editor (Photoshop / GIMP) for quick exports
2) Prepare the data
Locate and inspect the dataset — column names I used: insured amount, patient id, hospital id, doctor id, date, age, gender, medical_condition, provider, etc.
Clean & standardize — remove duplicates, fix datatypes (Date, Numeric), trim text, fill nulls where appropriate. In Power Query:
Replace Values,Detect Data Type,Remove Duplicates.Split & normalize — if a column contains combined info (e.g., “provider – code”) split into separate columns. Create lookup tables for
Providers,MedicalConditions,Dates(Date table).Date table — create a proper calendar table (continuous dates) and mark it as Date table in Power BI.
3) Data model & key measures (DAX)
Create relationships: facts → (Date, Provider, Condition). Keep model star-shaped.
Example DAX measures I used:
Total Insured Amount = SUM( FactHealthcare[InsuredAmount] )
Total Patients = DISTINCTCOUNT( FactHealthcare[PatientID] )
Hospitals Count = DISTINCTCOUNT( FactHealthcare[HospitalID] )
Doctors Count = DISTINCTCOUNT( FactHealthcare[DoctorID] )
Create measures for gender-splits and KPIs:
Patients_Female = CALCULATE( [Total Patients], FactHealthcare[Gender] = "Female" )
Patients_Male   = CALCULATE( [Total Patients], FactHealthcare[Gender] = "Male" )
Use FORMAT() for display-friendly KPIs (e.g., FORMAT([Total Insured Amount]/1e9, "0.00") & "bn").
4) Build visuals in Power BI
Design components shown in my dashboard:
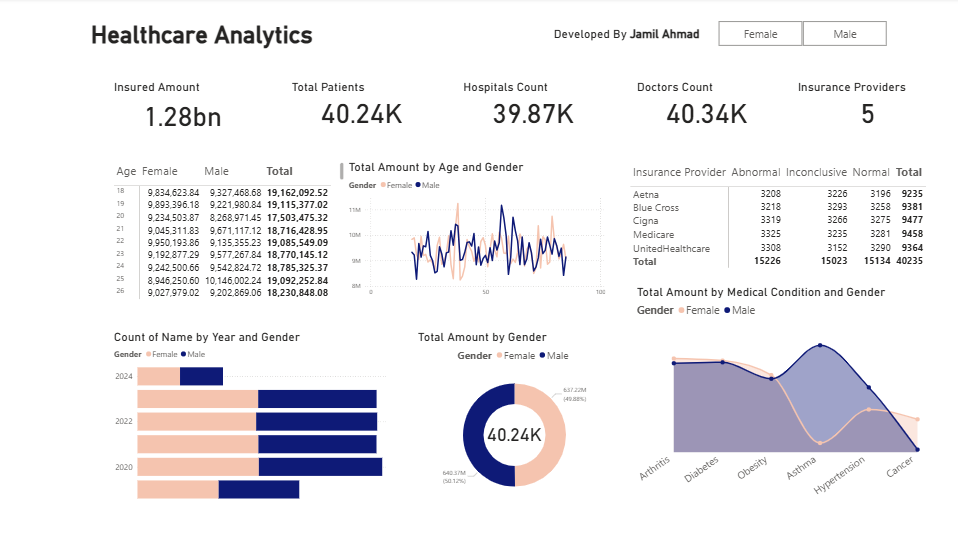
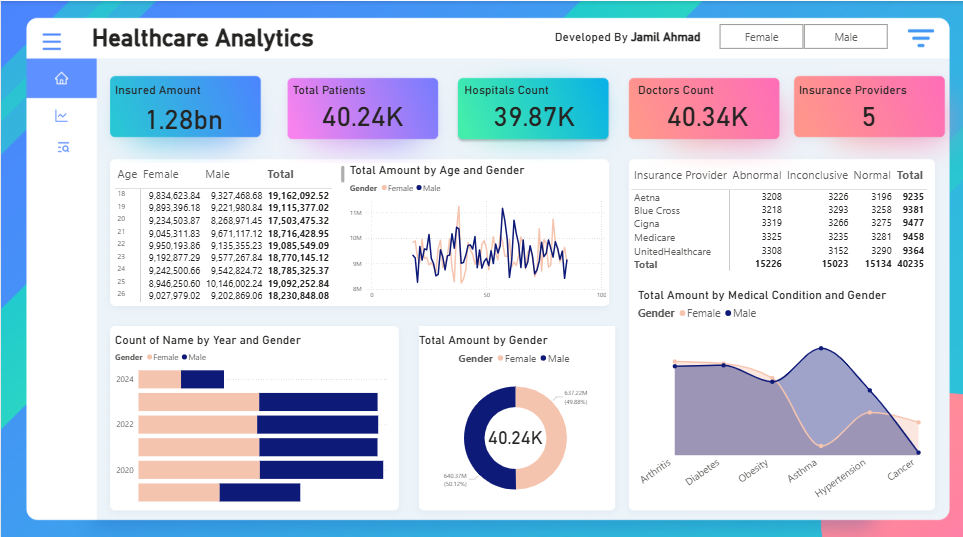
Top KPI cards — Insured Amount, Total Patients, Hospitals Count, Doctors Count, Providers. Use
Cardvisuals inside bordered containers; apply gradient backgrounds in the format pane.Age by Gender table — small table visual for age buckets with totals.
Line chart — Total amount by Age & Gender (use
Small multiplesorLegendfor gender).Stacked bar — Count by Year & Gender (use
Bar chartwith year on axis)Donut chart — Total Amount by Gender (center text with a Card visual overlay for value)
Area/Line combo — Total Amount by Medical Condition and Gender (use
Area chart+Linecombination).Table for providers — Basic table with conditional formatting (abnormal/inconclusive count, total).
Tips:
Use Bookmarks + Buttons if you want “toggle female/male” presets.
Use Sync slicers to keep filters in sync across pages.
Keep visuals to a practical minimum to preserve performance.
5) Visual design — Figma + Power BI
Designing background in Figma
Create a 16:9 canvas with the same resolution you’ll use in Power BI (e.g., 1920×1080).
Design a soft gradient or pattern that matches your brand. Add a framed area where the report will sit (margin guides). Export two versions:
Dashboard image WITH background (full composition).
Dashboard image WITHOUT background (transparent region where the report lives) — export PNG with transparency or export separate elements so you can overlay them inside Power BI.
Use subtle shapes, gradients, and card shadows — keep center area lower contrast so visuals are readable.
Applying background in Power BI
Format → Page background → Add image (set Fit to
FitorFill; adjust transparency).Alternatively, place the background as a large Image visual at the back and lock it with Selection Pane → Bring to Back.
Make sure the background contrast doesn’t reduce datapoint readability.
6) Export variants for sharing
I exported two images (as you said you have):
dashboard_no_bg.png— report visuals only (transparent/clean, for mockups or overlay).dashboard_with_bg.png— full screenshot with Figma background applied (for final presentation).
How to export:
Use Power BI Desktop: File → Export → Export to PDF / or Use
Snip & Sketch/ high quality screenshot tools.For export with transparent background you’ll need to export visuals and composite them via Figma or an image editor (Power BI doesn’t natively export a transparent background for the entire report canvas).
7) Creating a mockup (what I did)
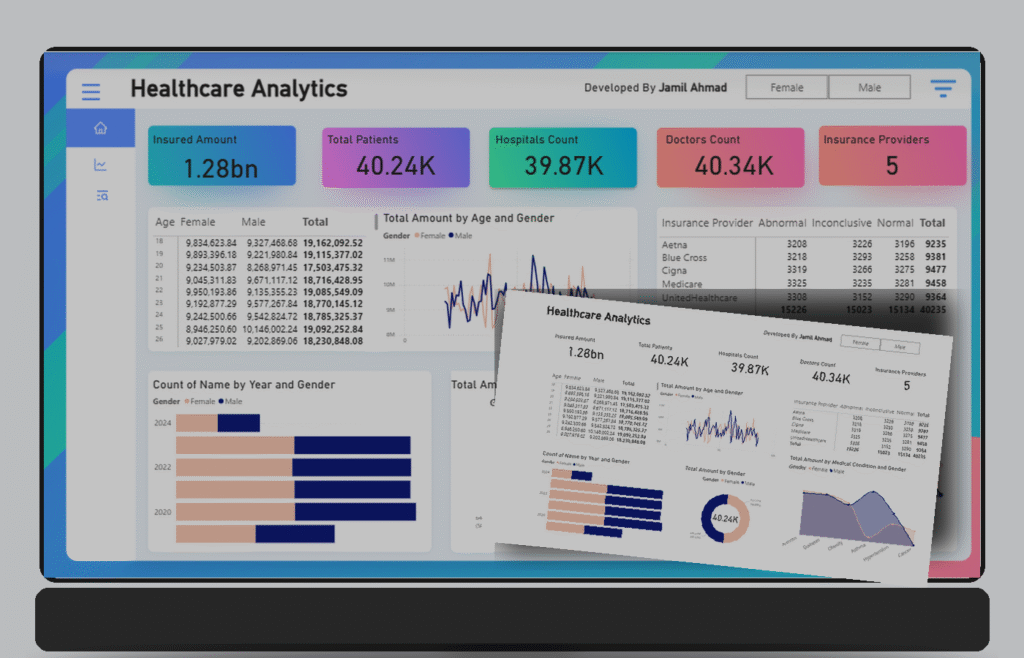
I created a laptop mockup that places the version with the Figma background on the laptop screen and the “no background” version as a floating overlay in front — great for social media and blogs. You can reproduce this in Figma/Canva by:
Use a laptop device frame asset (search “laptop mockup” in Figma or free mockups).
Place the
with_bgscreenshot on the screen.Place
no_bgscreenshot as a foreground card, add shadow and slight rotation.Export high-res PNG for LinkedIn/blog.
Download the mockup I generated: Dashboard mockup image
8) Performance & polish
Avoid too many high-card visuals on one page — they increase load.
Use aggregations where possible — import pre-aggregated data for very large datasets.
Reduce visuals that use heavy custom visuals; use native visuals for better performance.
Use
Query Foldingin Power Query to push transformations to source when possible.
9) Publish & share
Publish to Power BI Service → Create App workspace → Publish.
Adjust permissions (Private workspace, share with selected users).
If you want to share a public sample, use Publish to web (be aware of data sensitivity — avoid PHI).
For LinkedIn and blog: share screenshots, a short explainer, and a CTA to download PBIX.
10) Files & next steps
If you want the PBIX file, comment PBIX on my LinkedIn post (or reply here) and I’ll send it.
If you want, I can also:
Provide the exact PBIX used to generate these screenshots.
Export social media-ready image sizes.
Provide a zip with PNG assets and the Figma source.