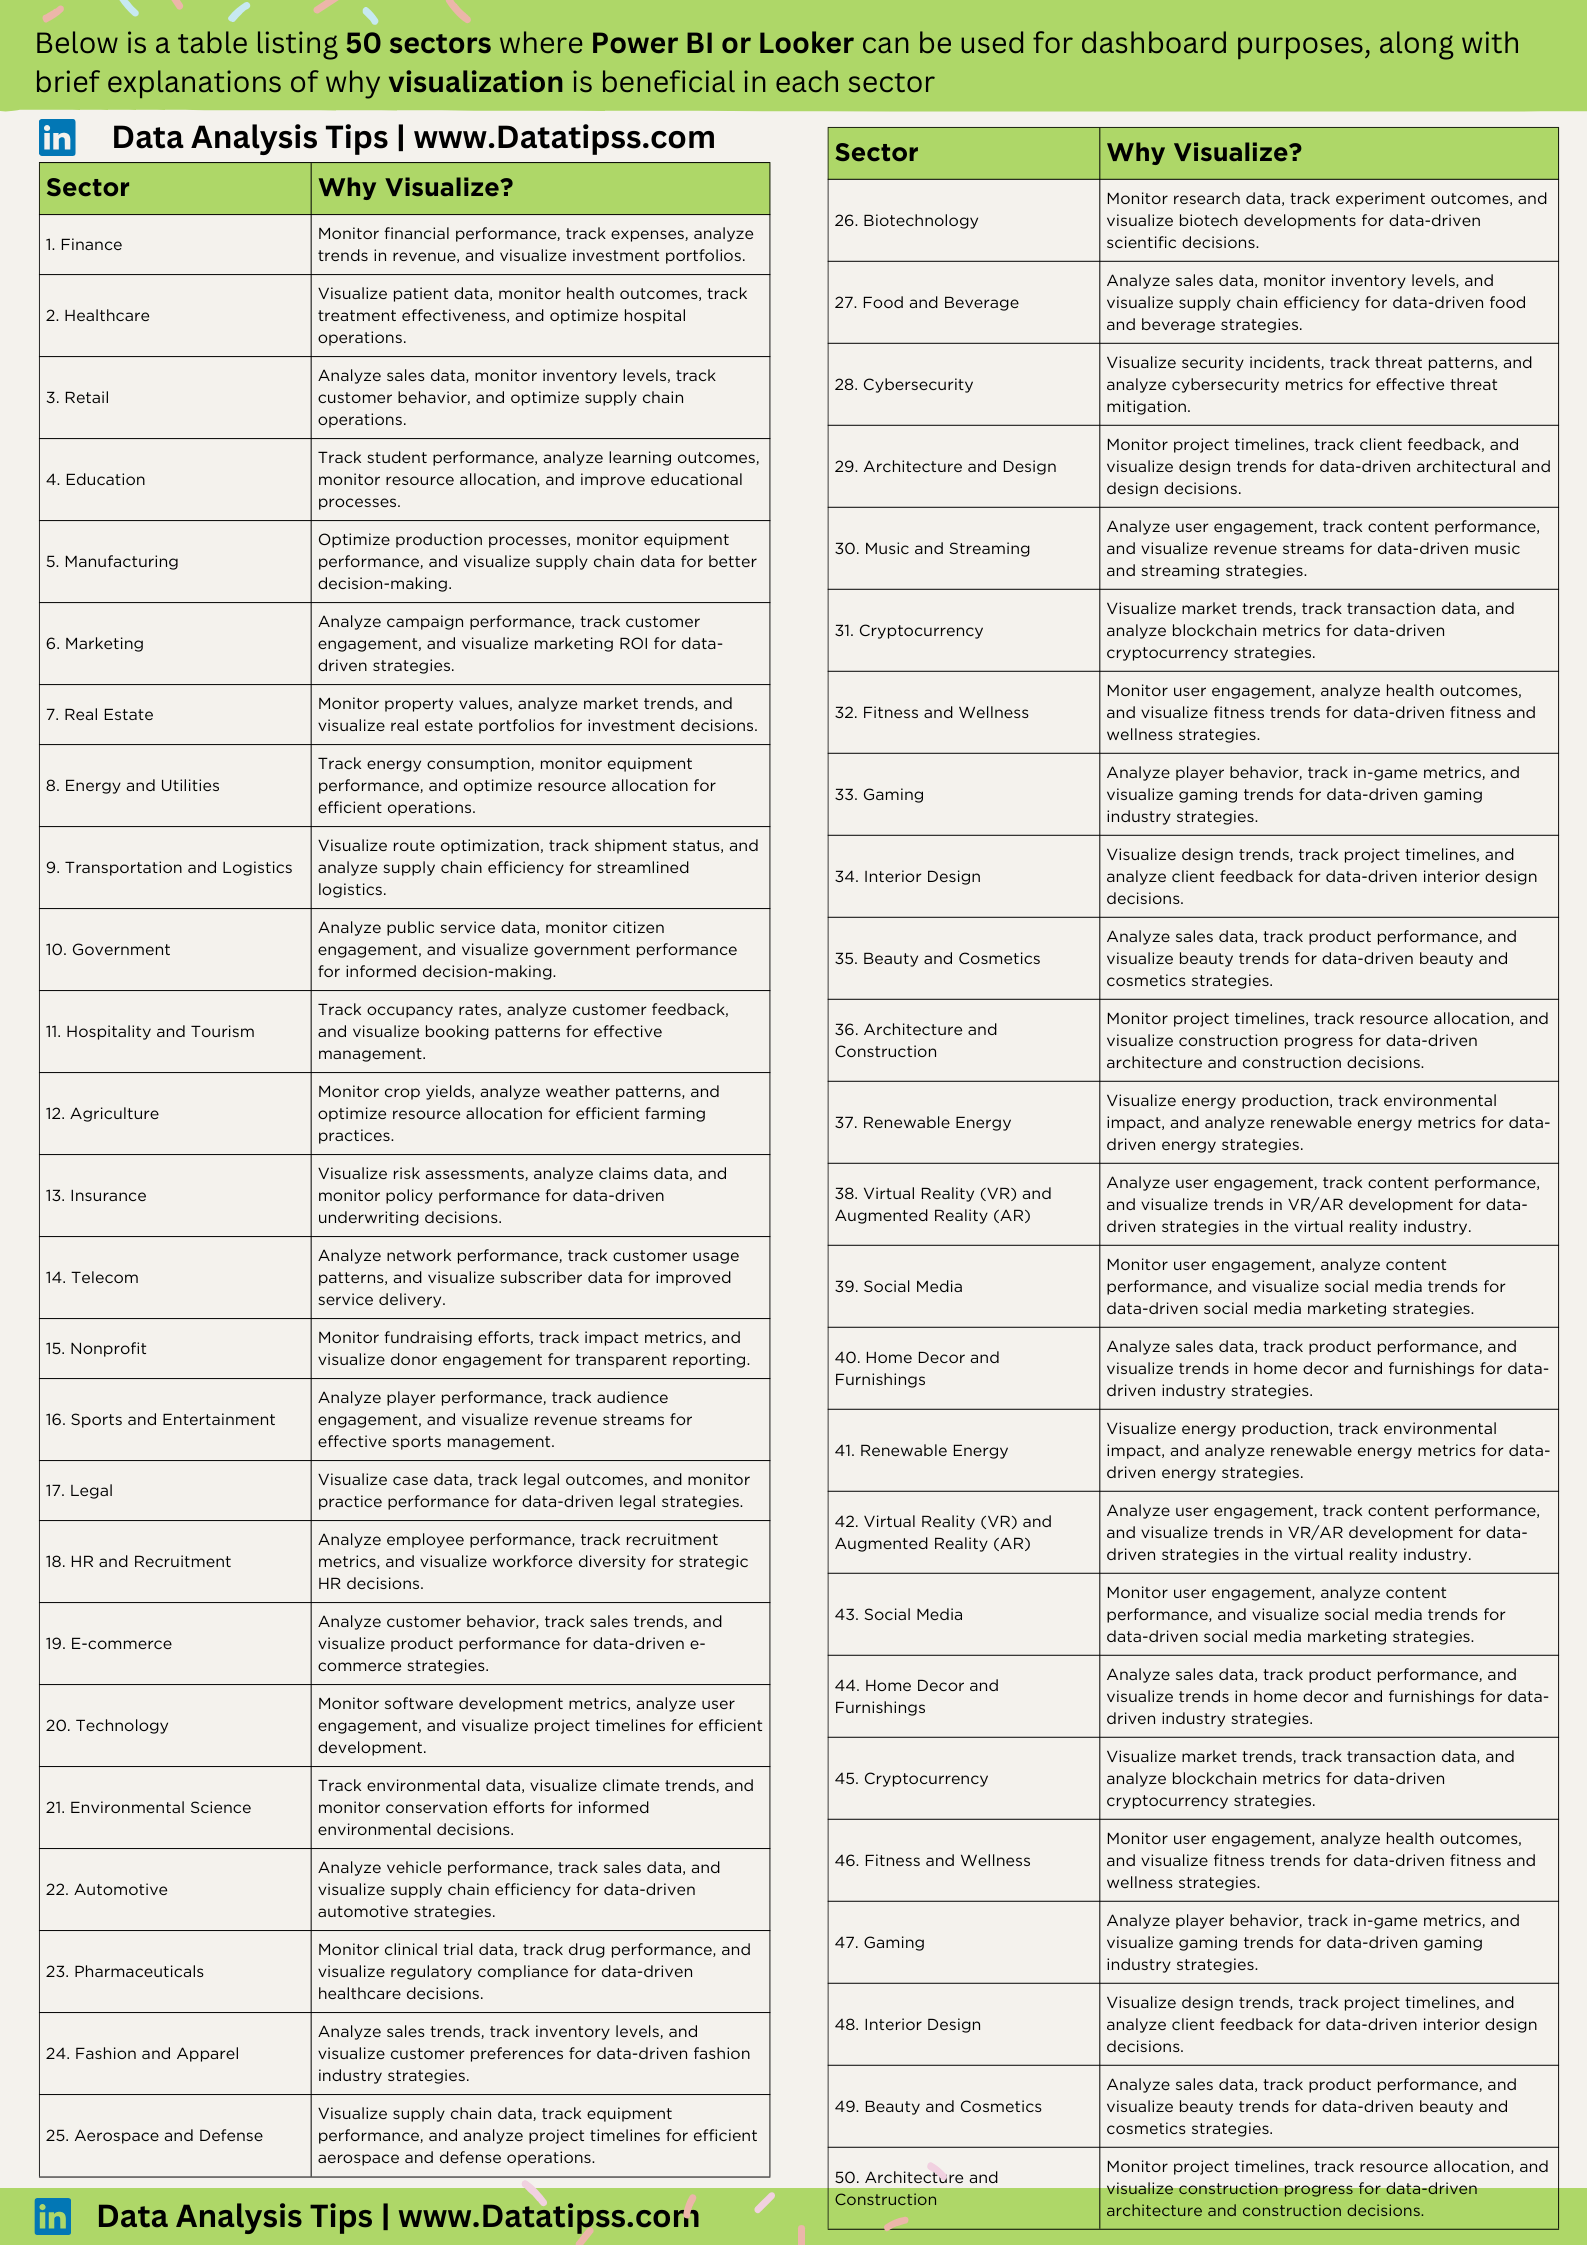
Unlocking Insights: Data Visualization Across 50 Sectors

In the dynamic landscape of data analytics, the power of visualization cannot be overstated. The ability to transform raw data into compelling visuals not only enhances understanding but also drives informed decision-making across diverse industries. In this blog post, we explore the vast applications of data visualization using powerful tools like Power BI and Looker,…