How Hermes Agent Can Transform a Data Analyst’s Workflow
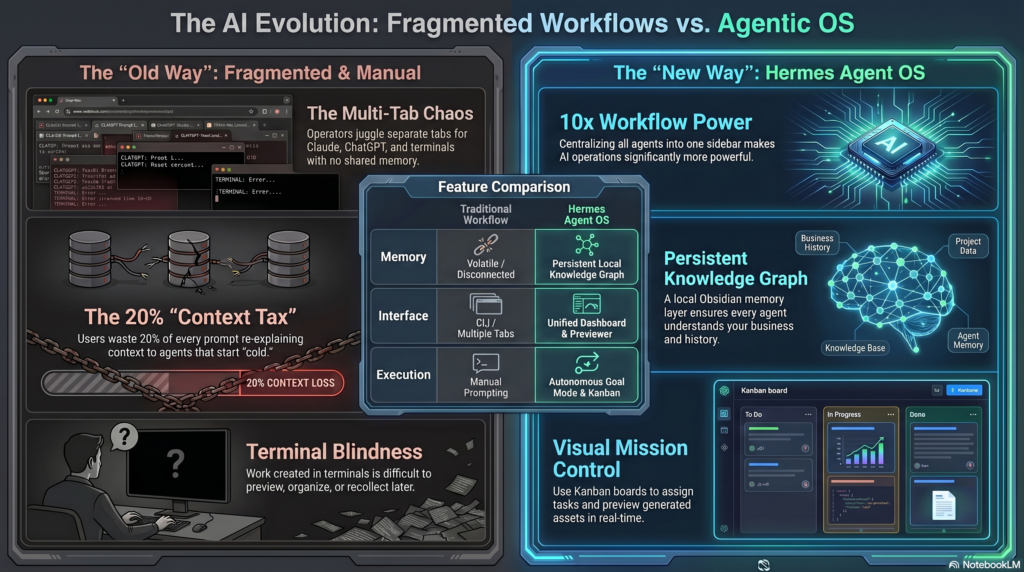
Artificial Intelligence is rapidly changing how data analysts work. While most professionals are familiar with tools like Power BI, Python, SQL, and Excel, a new category of AI tools is emerging: autonomous AI agents. One of the most interesting developments in this space is Hermes Agent, an open-source AI agent developed by Nous Research. Unlike […]
How Hermes Agent Can Transform a Data Analyst’s Workflow Read More »