
Introduction to Healthcare Dataset Analysis
Case Study 001
Welcome to this comprehensive guide on analyzing a synthetic healthcare dataset. This dataset has been meticulously crafted to simulate real-world healthcare data, making it an invaluable resource for data science, machine learning, and data analysis enthusiasts. Whether you are a seasoned professional or a budding analyst, this dataset offers a rich playground for honing your skills in data manipulation, statistical analysis, and predictive modeling within the healthcare industry.
Data Source: https://www.kaggle.com/datasets/prasad22/healthcare-dataset
The dataset includes a variety of fields that provide a detailed overview of patient information, hospital operations, and medical treatments. Here are the key columns present in the dataset:
- Name: The full name of the patient.
- Age: The age of the patient.
- Gender: The gender of the patient.
- Blood Type: The blood type of the patient.
- Medical Condition: The medical condition or diagnosis of the patient.
- Date of Admission: The date the patient was admitted to the hospital.
- Doctor: The name of the doctor overseeing the patient’s care.
- Hospital: The name of the hospital where the patient was admitted.
- Insurance Provider: The insurance provider covering the patient’s medical expenses.
- Billing Amount: The total billing amount for the patient’s treatment.
- Room Number: The room number where the patient was accommodated.
- Admission Type: The type of admission (e.g., emergency, routine).
- Discharge Date: The date the patient was discharged from the hospital.
- Medication: The medications prescribed to the patient.
- Test Results: The results of medical tests conducted.
Initial Data Cleaning: Correcting Name Formats

When working with real-world data, one of the first steps is often data cleaning, which ensures that the data is in a consistent and usable format. In our dataset, we observed that the patient names were not uniformly formatted. To address this, we used Excel’s PROPER function, which capitalizes the first letter of each word in a text string and converts all other letters to lowercase. This simple yet effective formula helps standardize the names, making further analysis more straightforward.
Here’s a step-by-step guide on how we corrected the name formats using Excel:
- Open the Excel file containing the dataset and select the column with the names.
- Use the
PROPERFunction:
- Assume the names are in column A starting from cell A1. In cell B1, enter the following formula:
excel =PROPER(A1) - This formula converts the name in cell A1 to proper case, where the first letter of each word is capitalized, and the rest are lowercase.
- Apply the Formula to the Entire Column:
- Drag the fill handle (a small square at the bottom-right corner of the selected cell) down to apply the formula to all cells in column B corresponding to the names in column A.
- Copy and Paste as Values:
- Select all the cells in column B that contain the formula.
- Press
Ctrl+Cto copy the selected cells. - Right-click on cell A1 (or the first cell of the original column) and choose
Paste Special->Values. This replaces the original names with the corrected ones.
This initial step of cleaning the data ensures that all names are uniformly formatted, setting the stage for more advanced data analysis. With clean and consistent data, we can now dive into deeper statistical and analytical calculations to uncover valuable insights within the healthcare dataset.
Creating a Comprehensive Pivot Table for Healthcare Data Analysis

Setting Up the Pivot Table
For this analysis, we created a Pivot Table that provides insights into patient admissions based on various dimensions such as the patient’s name, the hospital they were admitted to, and their medical condition. Additionally, we incorporated the date of admission to observe trends over time. Here’s a step-by-step breakdown of how we set up and structured the Pivot Table:
- Rows:
- Name: The full name of the patient.
- Hospital: The name of the hospital where the patient was admitted.
- Medical Condition: The diagnosed medical condition of the patient.
- Columns:
- Date of Admission: We broke down the date of admission into years and months to facilitate a detailed time-based analysis.
- Values:
- Count of Name: This value shows the number of admissions, effectively counting how many times each patient was admitted under different conditions and hospitals.
Explanation and Insights
- Patient Names: Listed in the first column, we can see the detailed admissions data for each patient.
- Hospital: The second column shows the hospitals associated with each patient.
- Medical Condition: The third column details the medical conditions for which the patients were admitted.
- Date of Admission: The columns are divided by years and months, allowing us to track admissions over time.
- Count of Name: The values in the table represent the count of admissions for each combination of patient, hospital, and medical condition. For example, Jennifer Taylor was admitted once in 2022 for Cancer at the “and Rodriguez Bell, Short” hospital.
This Pivot Table serves as a foundational tool for our healthcare dataset analysis. By summarizing patient admissions across different dimensions, we can derive valuable insights into trends and patterns in healthcare delivery. In subsequent sections of this blog, we will delve deeper into specific analyses, exploring correlations and trends that can inform healthcare practices and policies.
Trends in Medical Condition Admissions (2019-2024)

The chart titled “Trends in Medical Condition Admissions (2019-2024)” displays the following:
- The X-Axis represents the years of admission, spanning from 2019 to 2024.
- The Y-Axis shows the count of admissions for each medical condition.
- Each line on the chart corresponds to a specific medical condition, enabling us to compare trends across different conditions simultaneously.
Observations:
- Arthritis: Admissions for arthritis saw a significant increase in 2020, peaking at 1871, and then slightly fluctuated over the following years before dropping sharply in 2024.
- Asthma: The number of asthma admissions remained relatively stable with minor fluctuations, peaking in 2021 at 1822 before gradually decreasing.
- Cancer: Cancer admissions also showed fluctuations, with a notable increase in 2020 (1882) followed by a general decline, reaching the lowest point in 2024 (618).
- Diabetes: Diabetes admissions peaked in 2022 at 1922, showing an increasing trend overall until a decrease in 2024.
- Hypertension: Similar to diabetes, hypertension admissions increased up to 2023 before a notable decrease in 2024.
- Obesity: Admissions for obesity saw a peak in 2020 and then experienced a gradual decline, reaching the lowest point in 2024.
Gender-Based Distribution of Medical Condition Admissions
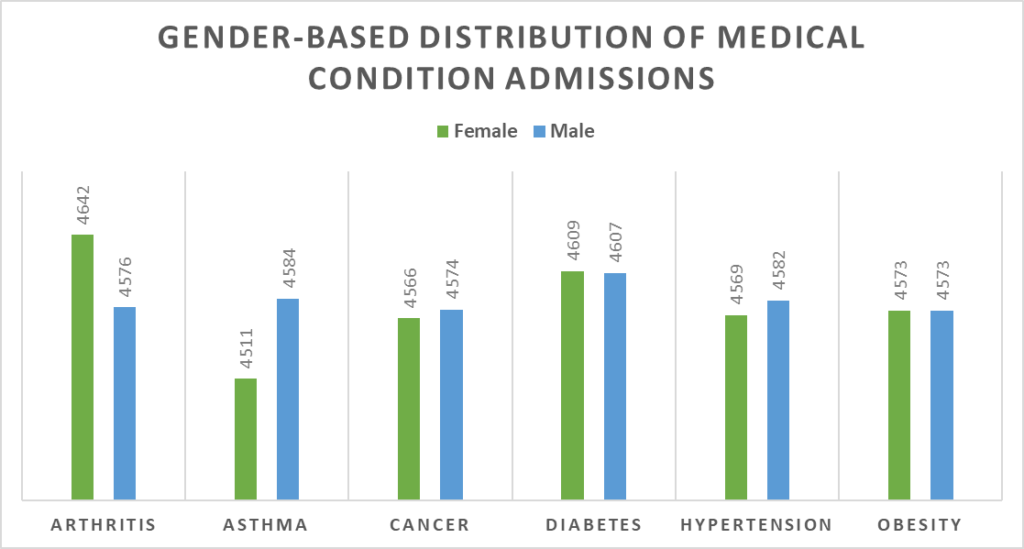
Observations:
- Arthritis: Admissions for arthritis are slightly higher among females (4642) compared to males (4576).
- Asthma: Males have a slightly higher number of asthma admissions (4584) than females (4511).
- Cancer: Cancer admissions are almost evenly distributed between genders, with females having 4566 and males having 4574.
- Diabetes: Both genders have a similar number of diabetes admissions, with females at 4609 and males at 4607.
- Hypertension: Hypertension shows a slight prevalence in males (4582) compared to females (4569).
- Obesity: Admissions for obesity are equal for both genders, each recording 4573.
This analysis helps to:
- Understand the distribution of medical conditions between females and males.
- Identify any significant gender disparities in medical condition admissions.
- Provide a basis for targeted healthcare interventions and policies.
Key Findings:
- Arthritis: The data indicates a higher prevalence of arthritis among females compared to males.
- Asthma: Males have a slightly higher number of asthma-related admissions.
- Cancer: Cancer admissions are nearly equal between both genders, suggesting similar rates of occurrence.
- Diabetes: There is no significant difference in diabetes admissions between genders.
- Hypertension: Males have a marginally higher number of hypertension admissions.
- Obesity: Both genders have an equal number of admissions for obesity, highlighting no gender disparity in this condition.