Category: Digital

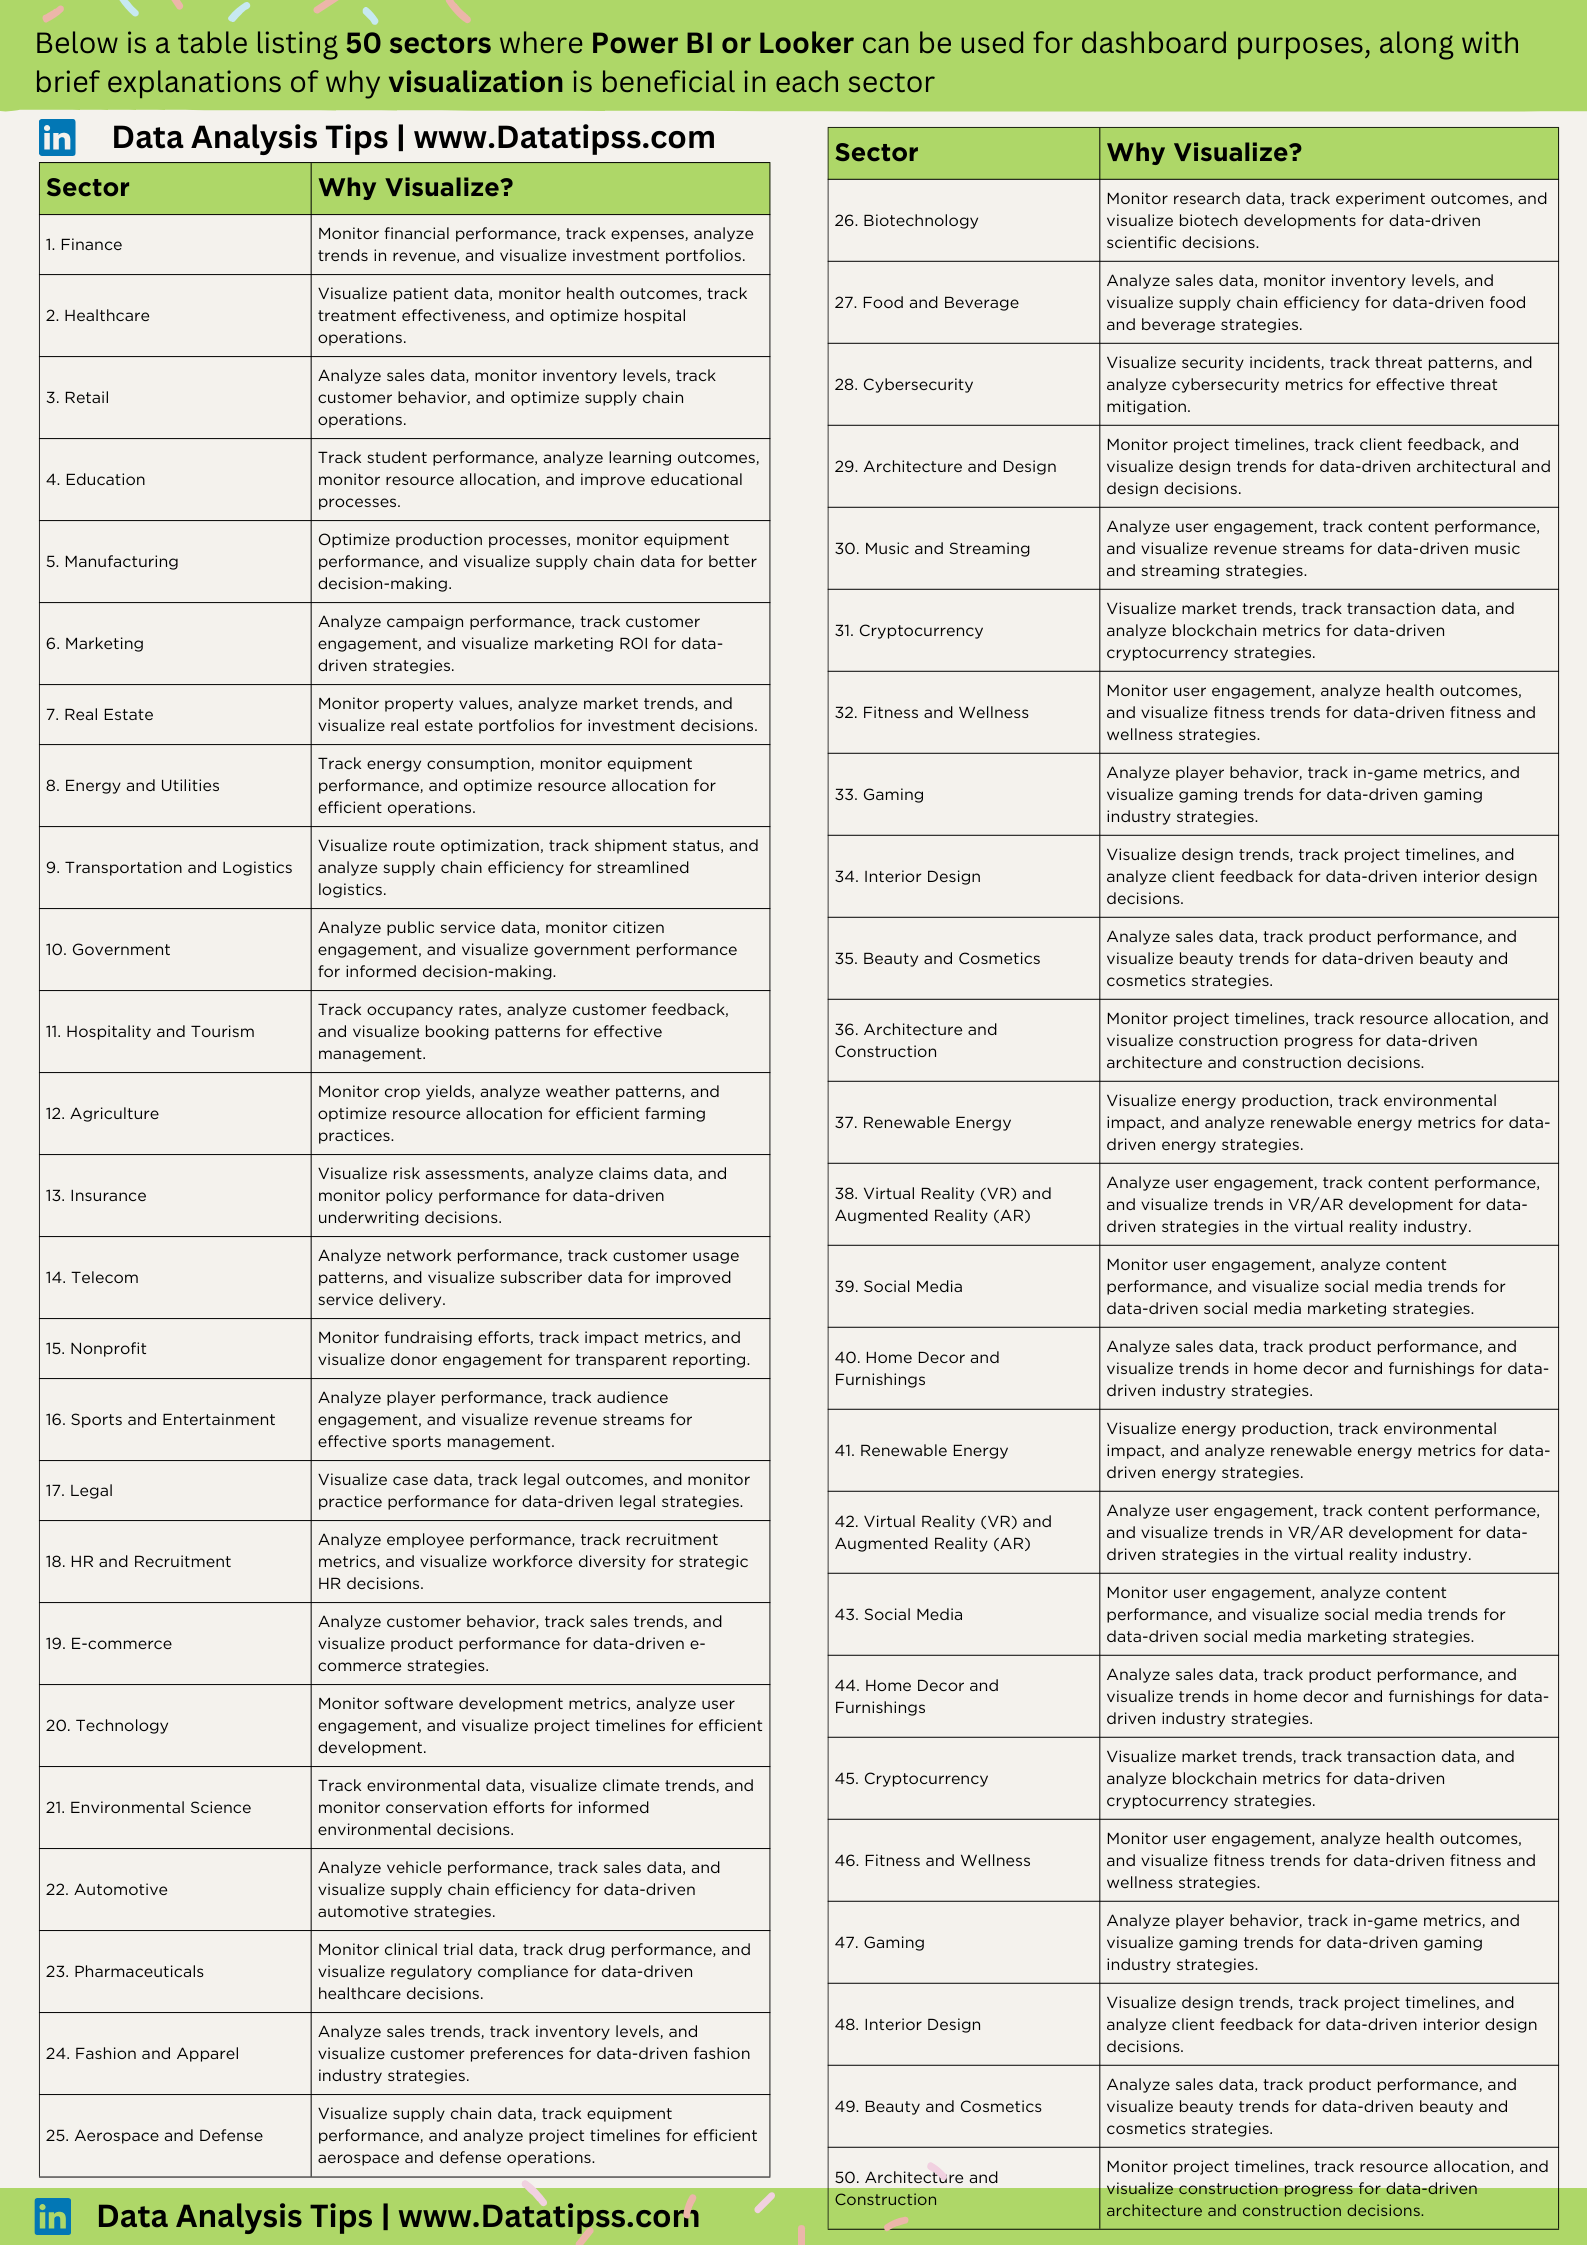
Unlocking Insights: Data Visualization Across 50 Sectors
In the dynamic landscape of data analytics, the power of visualization cannot be overstated. The ability to transform raw data into compelling visuals not only enhances understanding but also drives informed decision-making across diverse industries. In this blog post, we explore the vast applications of data visualization using powerful tools like Power BI and Looker,…
What We Watched: A Netflix Engagement Report
Netflix published the first half of 2023 engagement data Netflix Top 20 Genre Viewed Globally (in Million Hours) – Jan 2023 to Jun 2023 Report compiled by Datatipss.com & The data source for the following analysis is Kaggle In the dynamic world of streaming, understanding viewer preferences is paramount. Here’s a glimpse into the top…