
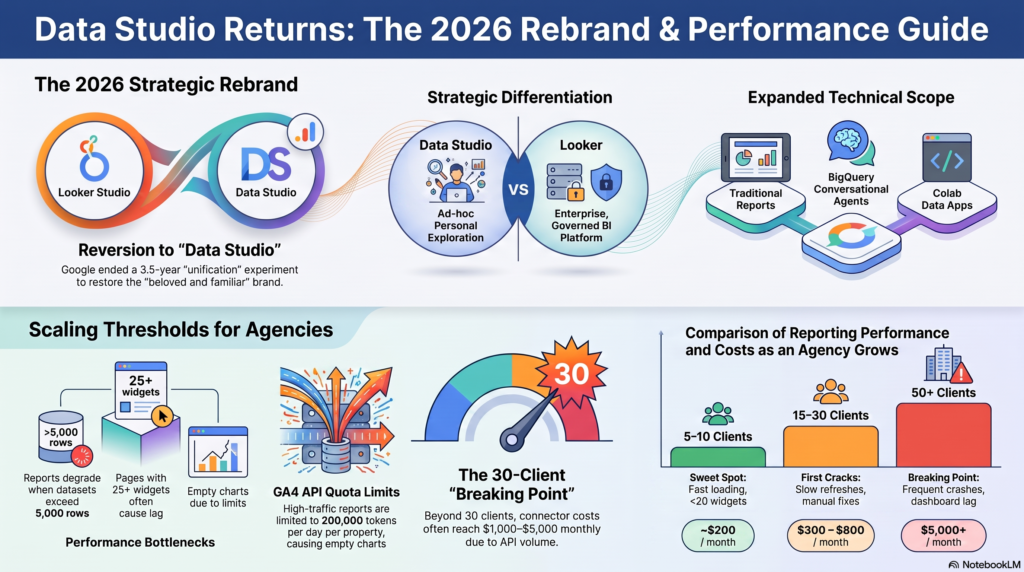
On April 11, 2026, Google executed a surprising strategic reversal that signaled the end of a long-standing identity crisis in the analytics world: it officially retired the “Looker Studio” brand and reintroduced the “Data Studio” name. This move marks the conclusion of a 3.5-year experiment in product unification that began in October 2022. For users who have navigated years of branding shifts, this return to the original nomenclature is more than a cosmetic update; it is a confession that attempting to consolidate disparate tools under one “Looker” umbrella created more friction and market confusion than it solved.
As a strategist, I see this as a necessary pivot. While the unification looked clean on an organizational chart, it ignored the reality of how users perceive value. Our goal today is to dissect why this name change happened and what the latest technical data shows about the tool’s inherent limitations for agencies attempting to scale.
The Power of Brand Equity: Why “Data Studio” Won
The October 2022 strategy was designed to position Looker as the flagship enterprise platform while absorbing Data Studio into the “Looker family.” However, by sharing a primary name between a high-end governed BI platform and a lightweight visualization tool, Google diluted both. This created a positioning problem where sales teams struggled to differentiate the two, and customers were left guessing which “Looker” suited their needs.
The reversal illustrates a vital lesson: brand equity earned over a decade shouldn’t be discarded for the sake of internal hierarchy. By returning to the original brand, Google is acknowledging the massive user base that associates “Data Studio” with rapid, accessible reporting.
“Data Studio [is] a ‘beloved and familiar name’ being ‘reintroduced’ as the official brand for its lightweight analytics and visualization tool.” — Google Cloud Blog announcement
Strategic Divorce: Looker vs. Data Studio
This rebrand represents a “strategic divorce” that serves the customer by providing immediate clarity. From a consultant’s perspective, this move is brilliant because it protects the core Looker brand. By separating the names, Google prevents the “bugginess” or performance ceilings of the free tool from tarnishing the reputation of Looker’s enterprise-grade, governed environment.
| Feature | Data Studio | Looker |
| Positioning | Entry-level, self-service visualization | Enterprise Business Intelligence platform |
| Primary Use Case | Ad-hoc reporting and personal exploration | Governed data and semantic models |
| Target User | Individual Business User / Marketer | Data Engineer / Enterprise Teams |
| Governance Level | Lightweight / Individual assets | High / Centralized semantic layer |
| Data Interaction | Quick, exploratory charts | Trusted, agentic AI-driven analysis |
This separation acknowledges that a “one-size-fits-all” name cannot effectively cover both a rapid reporting tool and a massive, governed enterprise platform.
More Than a Dashboard: The New Technical Scope
The return to the Data Studio name coincides with an expansion of the platform’s technical reach. It is no longer strictly a reporting tool; it has evolved into a “content browser” for the Google Data Cloud. Users now interact with three distinct asset types through a unified interface:
- Traditional Data Studio Reports: The familiar dashboard layer used since 2016.
- BigQuery Conversational Agents: Natural language interfaces powered by Gemini AI, allowing non-technical users to query data without writing SQL.
- Colab Notebook Data Apps: Programmatic, Python-based analytical experiences for data scientists.
This transformation suggests that Data Studio is now the “navigation layer” for the Data Cloud. By integrating Colab and Gemini-powered agents, Google has bridged the gap between the business analyst and the data scientist, allowing them to collaborate within a single asset browser.
The “Breaking Point”: When Free Becomes Expensive
For many agencies, the “free” price tag of Data Studio acts as a siren song that leads toward a technical “breaking point.” As an agency scales, the “invisible wall” manifests in predictable, painful stages based on client volume:
- 15–30 Clients: Maintenance begins to dominate. Multiple team members accessing reports simultaneously causes significant lag. Agencies start hitting “technical debt” as they realize one update to a report can break dozens of others.
- 30–40 Clients: Monthly costs for third-party connectors climb to the 1,000–3,000 range. Reports take 1–3 minutes to load, and teams experience frequent API quota limits.
- 50+ Clients: The “free” tool becomes a liability. Reports crash regularly, and dashboard lag can exceed five minutes. Between connector fees (5,000+), developer hours spent on workarounds, and manual quality assurance, the real cost of “free” often lands between **3,800 and $11,400 per month**.
“The spreadsheet had become technical debt, costing time and headcount… the real cost of even the free version lands somewhere between $3,800 and $11,400 per month.” — Swydo Agency Analysis
The Performance Plateau: Hard Limits You Can’t Ignore
Data Studio possesses technical constraints that act as hard ceilings. These limits make the “Pro” tier or the adoption of BigQuery a necessity rather than an option:
- Dataset Struggle: Performance often degrades significantly once a dataset exceeds 5,000 rows.
- Data Blending Cap: Charts are limited to a maximum of five data sources, hindering unified cross-channel views.
- GA4 API Quotas: High-traffic properties often hit the 200,000 token daily limit (per property, per day), causing reports to display empty charts.
The “Pro” Solution: Upgrading to Data Studio Pro is often the only way to scale. Pro features include Customer-Managed Encryption Keys (CMEK) and Customer-Managed Storage for enterprise-grade security, as well as data residency controls and higher quotas that bypass the standard “throttling” that cripples free-tier agencies.
The Connectivity Cheat Sheet: 3 Ways to GA4
Connecting GA4 data remains the primary use case for Data Studio, but you must choose your method based on your scale:
- Native GA4 Connector: Fastest setup (30 seconds) and zero cost. The Trap: Subject to “Sampling” and “Thresholding” on high-traffic properties, which can lead to inaccurate reports for small user cohorts.
- BigQuery + Data Studio: The “Gold Standard.” By exporting raw GA4 events to BigQuery, users access unsampled, unaggregated data with no row limits. This is essential for serious analysts needing historical data beyond GA4’s retention window.
- Partner Connectors (Supermetrics, Funnel): Best for agencies. These handle API quotas and authentication automatically across 100+ sources, though they carry substantial monthly costs.
Conclusion: A Return to Clarity
Google’s decision to revert to “Data Studio” is a pragmatic victory for market clarity over corporate branding ideals. By divorcing the tool from the “Looker” brand, Google has stabilized the product’s identity as the central hub for personal data exploration and ad-hoc analysis.
However, the rebrand does not change the fundamental nature of the tool. You must ask: are you currently using the “right” tool for your scale, or are you holding onto “free” at the cost of your own growth? The return of the name is a positive step toward stability, but the technical breaking point remains for those who attempt to scale without a clear, strategic data infrastructure.
Also see PPT at our LinkedIn post
DataStudio #GoogleDataStudio #LookerStudio #BusinessIntelligence #DataAnalytics #DataVisualization #Dashboard #GoogleAnalytics #BigQuery #PowerBI #SQL #Excel #DataScience #MarketingAnalytics #Datatipss