How I built a polished Healthcare Analytics dashboard (Figma + Power BI) — step-by-step

Intro (TL;DR)
I built a modern Healthcare Analytics dashboard (public healthcare data) using Power BI for visuals and Figma for background design. In this post I’ll show exactly how I prepared the data, built the report, styled the UI in Figma, exported two image variants (with and without background), and produced a mockup for sharing. If you want the full PBIX file, comment PBIX on my LinkedIn post and I’ll send it.


1) What I used

  • Power BI Desktop (latest stable)

  • Figma (for background & assets)

  • Public healthcare dataset (you can use any CSV / public API)

  • Optional: image editor (Photoshop / GIMP) for quick exports


2) Prepare the data

  1. Locate and inspect the dataset — column names I used: insured amount, patient id, hospital id, doctor id, date, age, gender, medical_condition, provider, etc.

  2. Clean & standardize — remove duplicates, fix datatypes (Date, Numeric), trim text, fill nulls where appropriate. In Power Query: Replace Values, Detect Data Type, Remove Duplicates.

  3. Split & normalize — if a column contains combined info (e.g., “provider – code”) split into separate columns. Create lookup tables for Providers, MedicalConditions, Dates (Date table).

  4. Date table — create a proper calendar table (continuous dates) and mark it as Date table in Power BI.


3) Data model & key measures (DAX)

Create relationships: facts → (Date, Provider, Condition). Keep model star-shaped.

Example DAX measures I used:

dax

Total Insured Amount = SUM( FactHealthcare[InsuredAmount] )

Total Patients = DISTINCTCOUNT( FactHealthcare[PatientID] )

Hospitals Count = DISTINCTCOUNT( FactHealthcare[HospitalID] )

Doctors Count = DISTINCTCOUNT( FactHealthcare[DoctorID] )

Create measures for gender-splits and KPIs:

dax
Patients_Female = CALCULATE( [Total Patients], FactHealthcare[Gender] = "Female" )
Patients_Male = CALCULATE( [Total Patients], FactHealthcare[Gender] = "Male" )

Use FORMAT() for display-friendly KPIs (e.g., FORMAT([Total Insured Amount]/1e9, "0.00") & "bn").


4) Build visuals in Power BI

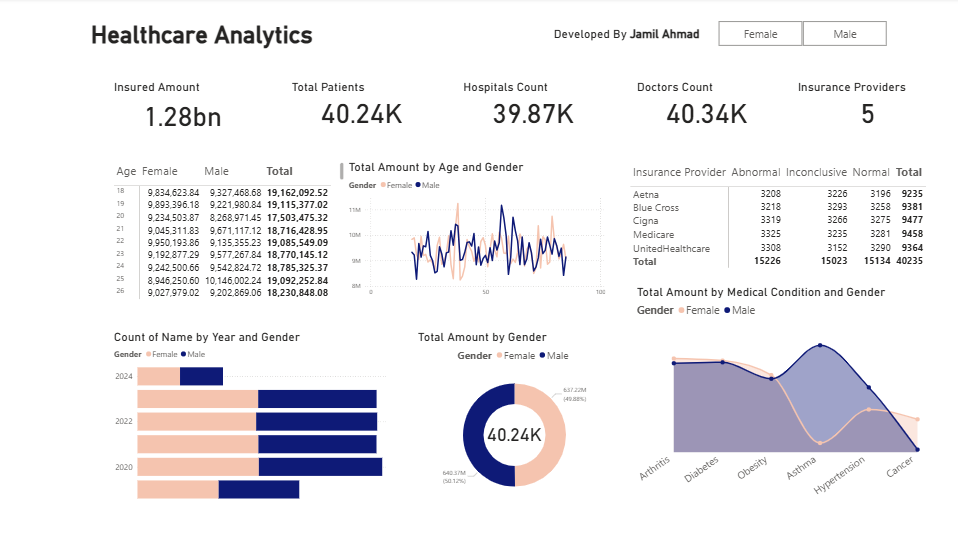
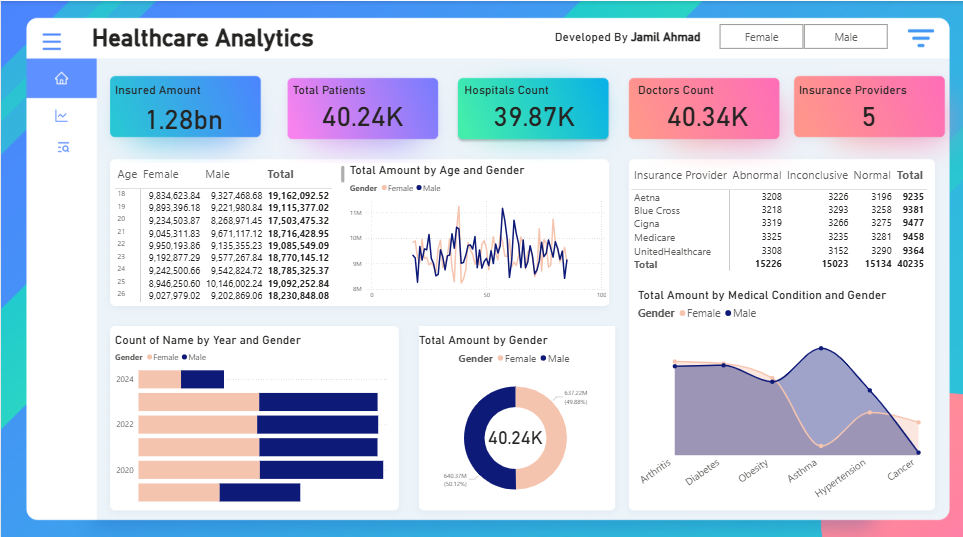
Design components shown in my dashboard:

  • Top KPI cards — Insured Amount, Total Patients, Hospitals Count, Doctors Count, Providers. Use Card visuals inside bordered containers; apply gradient backgrounds in the format pane.

  • Age by Gender table — small table visual for age buckets with totals.

  • Line chart — Total amount by Age & Gender (use Small multiples or Legend for gender).

  • Stacked bar — Count by Year & Gender (use Bar chart with year on axis)

  • Donut chart — Total Amount by Gender (center text with a Card visual overlay for value)

  • Area/Line combo — Total Amount by Medical Condition and Gender (use Area chart + Line combination).

  • Table for providers — Basic table with conditional formatting (abnormal/inconclusive count, total).

Tips:

  • Use Bookmarks + Buttons if you want “toggle female/male” presets.

  • Use Sync slicers to keep filters in sync across pages.

  • Keep visuals to a practical minimum to preserve performance.


5) Visual design — Figma + Power BI

Designing background in Figma

  1. Create a 16:9 canvas with the same resolution you’ll use in Power BI (e.g., 1920×1080).

  2. Design a soft gradient or pattern that matches your brand. Add a framed area where the report will sit (margin guides). Export two versions:

    • Dashboard image WITH background (full composition).

    • Dashboard image WITHOUT background (transparent region where the report lives) — export PNG with transparency or export separate elements so you can overlay them inside Power BI.

  3. Use subtle shapes, gradients, and card shadows — keep center area lower contrast so visuals are readable.

Applying background in Power BI

  • Format → Page background → Add image (set Fit to Fit or Fill; adjust transparency).

  • Alternatively, place the background as a large Image visual at the back and lock it with Selection Pane → Bring to Back.

  • Make sure the background contrast doesn’t reduce datapoint readability.


6) Export variants for sharing

I exported two images (as you said you have):

  • dashboard_no_bg.png — report visuals only (transparent/clean, for mockups or overlay).

  • dashboard_with_bg.png — full screenshot with Figma background applied (for final presentation).

How to export:

  • Use Power BI Desktop: File → Export → Export to PDF / or Use Snip & Sketch / high quality screenshot tools.

  • For export with transparent background you’ll need to export visuals and composite them via Figma or an image editor (Power BI doesn’t natively export a transparent background for the entire report canvas).


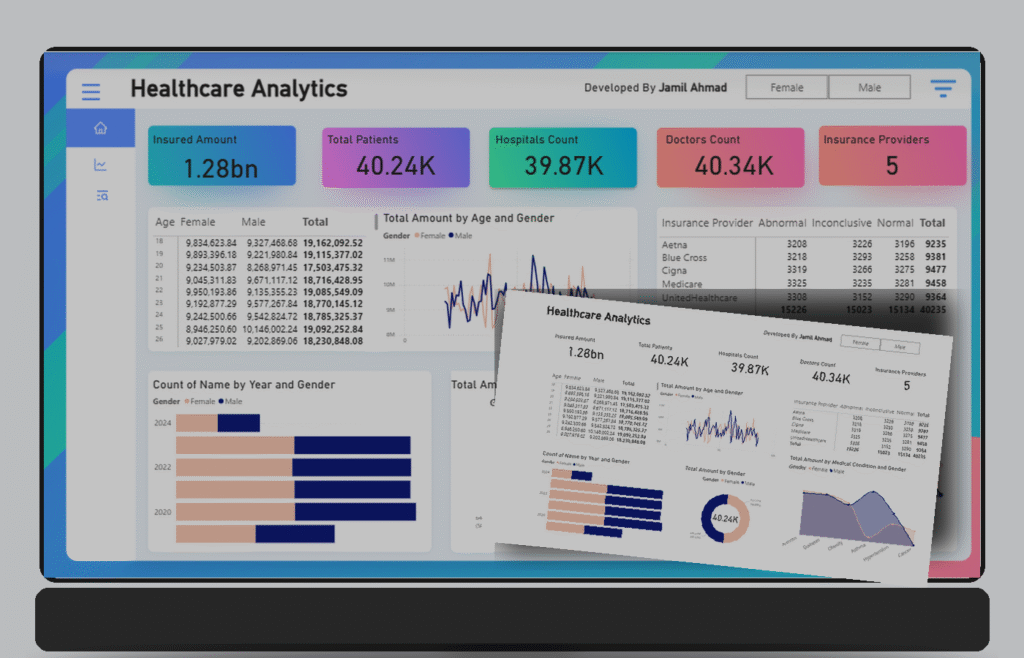
7) Creating a mockup (what I did)

I created a laptop mockup that places the version with the Figma background on the laptop screen and the “no background” version as a floating overlay in front — great for social media and blogs. You can reproduce this in Figma/Canva by:

  1. Use a laptop device frame asset (search “laptop mockup” in Figma or free mockups).

  2. Place the with_bg screenshot on the screen.

  3. Place no_bg screenshot as a foreground card, add shadow and slight rotation.

  4. Export high-res PNG for LinkedIn/blog.

Download the mockup I generated: Dashboard mockup image


8) Performance & polish

  • Avoid too many high-card visuals on one page — they increase load.

  • Use aggregations where possible — import pre-aggregated data for very large datasets.

  • Reduce visuals that use heavy custom visuals; use native visuals for better performance.

  • Use Query Folding in Power Query to push transformations to source when possible.


9) Publish & share

  • Publish to Power BI Service → Create App workspace → Publish.

  • Adjust permissions (Private workspace, share with selected users).

  • If you want to share a public sample, use Publish to web (be aware of data sensitivity — avoid PHI).

  • For LinkedIn and blog: share screenshots, a short explainer, and a CTA to download PBIX.


10) Files & next steps

If you want the PBIX file, comment PBIX on my LinkedIn post (or reply here) and I’ll send it.
If you want, I can also:

  • Provide the exact PBIX used to generate these screenshots.

  • Export social media-ready image sizes.

  • Provide a zip with PNG assets and the Figma source.

24 thoughts on “How I built a polished Healthcare Analytics dashboard (Figma + Power BI) — step-by-step”

  1. Давайте вернемся к теме
    самостоятельное составление плана поездки, продумывание всей логистики – продолжительный, и крайне сложный процесс.

  2. Beirut, Lebanon
    CNN

    A deadly Israeli airstrike on Hezbollah’s stronghold in southern Beirut on Friday has left over a dozen people dead, including a high-ranking Hezbollah commander, sharply escalating the conflict between the two sides and raising fears of all-out war.
    [url=][/url]
    Senior Hezbollah commander Ibrahim Aqil, part of Hezbollah’s elite Radwan Force, was assassinated along with “about 10” other commanders, Israel Defense Forces (IDF) spokesperson Daniel Hagari said, accusing them of planning to raid and occupy communities in Galilee in northern Israel.

    Hezbollah confirmed Aqil’s death on Friday, saying he was killed “following a treacherous Israeli assassination operation on 09/20/2024 in the southern suburbs of Beirut.”

    According to Hagari, the targeted commanders were “underground underneath a residential building in the heart of the Dahiyeh neighborhood, using civilians as a human shield” at the time of the attack.

    Lebanon’s health ministry said at least 14 people were killed and 66 others injured in the airstrike, which leveled a multistory building in a densely populated neighborhood.

    Aqil had a $7 million bounty on his head from the United States for his suspected involvement in the 1983 strike on the US Embassy in Beirut, which killed 63 people, as well as the bombing of the Beirut Marine barracks, which killed 241 US personnel later that year.

    A CNN team on the ground in Beirut saw a frantic effort to rescue people from underneath the rubble and rush the wounded to hospital. Witnesses said nearby buildings shook for nearly half an hour after the strike, which the IDF said it had carried out at around 4 p.m. local time.

    A week of surprise attacks
    Friday’s strike marked the fourth consecutive day of surprise attacks on Beirut and other sites across the country, even as Israeli forces continued deadly strikes and operations in Gaza and the occupied West Bank.

    The first major attack against Hezbollah this week came Tuesday afternoon when pagers belonging to the militant groups’ members exploded near-simultaneously. The pagers had been used by Hezbollah to communicate after the group’s leader, Hassan Nasrallah, encouraged members to switch to low-tech devices to prevent more of them from being assassinated.

    Almost exactly 24 hours later, Lebanon was rocked by a second wave of explosions, after Hezbollah walkie-talkies detonated in Beirut and the south of the country on Wednesday.

    At least 37 people were killed, including some children, and more than 3,000 were injured in the twin attacks.

    In a United Nations Security Council meeting on Friday, UN human rights chief Volker Turk on Friday warned that the detonation of communication devices could violate international human rights law.

    Lebanese Foreign Minister Abdallah Bou Habib and Israeli Ambassador to the UN Danny Danon clashed at the heated meeting, with Bou Habib calling on the council to condemn Israel’s actions and Danon slamming the Lebanese envoy for not mentioning Hezbollah.

  3. gorshok s avtopolivom_bfPt

    самополивающиеся горшки для цветов купить [url=kashpo-s-avtopolivom-kazan.ru]kashpo-s-avtopolivom-kazan.ru[/url] .

  4. [url=https://pf-monstr.work/]поведенческие факторы бот[/url] – бот-факторы

  5. Заказывали услугу асфальтирования территории. Результат превзошел все ожидания. Новое покрытие выглядит безупречно: ровное, гладкое и аккуратное.
    Особо хотим отметить профессионализм и оперативность вашей команды. Работы были выполнены в строго оговоренные сроки, без каких-либо задержек и с соблюдением всех необходимых норм и технологий. Сотрудники проявили внимательность к деталям, аккуратность и ответственность на каждом этапе работы.
    Мы приятно удивлены высоким качеством используемых материалов. Уверены, что новое асфальтовое покрытие прослужит нам долгие годы, обеспечивая комфорт и безопасность передвижения. – [url=https://telegra.ph/asfaltirovanie-ploshchadok-06-29]асфальтирование площадок цена[/url]

  6. [url=https://pf-monstr.work/]http://pf-monstr.work[/url] – улучшение поведенческих факторов

  7. [url=https://pf-monstr.work/]http://www.pf-monstr.work[/url] – накрутка ПФ и улучшение

  8. [url=https://pf-monstr.work/]pf-monstr.work/[/url] – улучшение поведенческих факторов и накрутка ПФ

  9. [url=https://pf-monstr.work/]http://www.pf-monstr.work[/url] – накрутка ПФ для проектов

  10. [url=https://pf-monstr.work/]продвижение на яндекс картах[/url] – локализованные методы

  11. [url=https://pf-monstr.work/]http://pf-monstr.work/[/url] – раскрутка сайта по ПФ

  12. [url=https://pf-monstr.work/]http://www.pf-monstr.work[/url] – накрутка ПФ для сайтов и проектов

  13. [url=https://pf-monstr.work/]https://www.pf-monstr.work/[/url] – поведенческие факторы оптимизация

  14. aqlli strategiyalar orqali g’alaba qozonishni mumkin. turli xil taqdim etadi.

    turli xil formatlarda . qimor tajribasidan mumkin.

    Bonuslar yordam beradi. ko’plab ma’lumotlar joylashgan maqolalar mavjud.

    taqdim etadi. himoya qilinadi . ishonch bilan kirishlari mumkin.
    888 старс [url=https://www.888starz-uzs.net]https://888starz-uzs.net/[/url]

  15. Excellent breakdown, I completely agree with the challenges you described. For our projects we started using an AI-driven system called AI link building by OptiLinkAI, and it has simplified the entire process. It’s refreshing to see technology finally making link acquisition smarter, not just faster.

  16. Attractive section of content I just stumbled upon your blog and in accession capital to assert that I get actually enjoyed account your blog posts Anyway I will be subscribing to your augment and even I achievement you access consistently fast

  17. I loved as much as youll receive carried out right here The sketch is tasteful your authored material stylish nonetheless you command get bought an nervousness over that you wish be delivering the following unwell unquestionably come more formerly again since exactly the same nearly a lot often inside case you shield this hike

  18. I just could not leave your web site before suggesting that I really enjoyed the standard information a person supply to your visitors Is gonna be again steadily in order to check up on new posts

Leave a Reply to gorshok s avtopolivom_bfPt Cancel Reply

Your email address will not be published. Required fields are marked *