

Introduction
Zillow has become a go-to platform for real estate enthusiasts, buyers, and analysts alike. With its comprehensive database of property listings, sales history, and market trends, Zillow offers a treasure trove of data that can be harnessed to identify price trends in the real estate market. In this post, we’ll explore how to leverage Zillow’s data to uncover these trends and make informed decisions.
Step 1: Accessing Zillow Data
To begin your analysis, you first need to gather data from Zillow. Zillow provides several ways to access its data, including the Zillow Research Data portal and the Zillow API. For this post, we’ll focus on using publicly available datasets from the Zillow Research Data portal.
Data Sources:
- Zillow Research Data Portal: Zillow Research Data
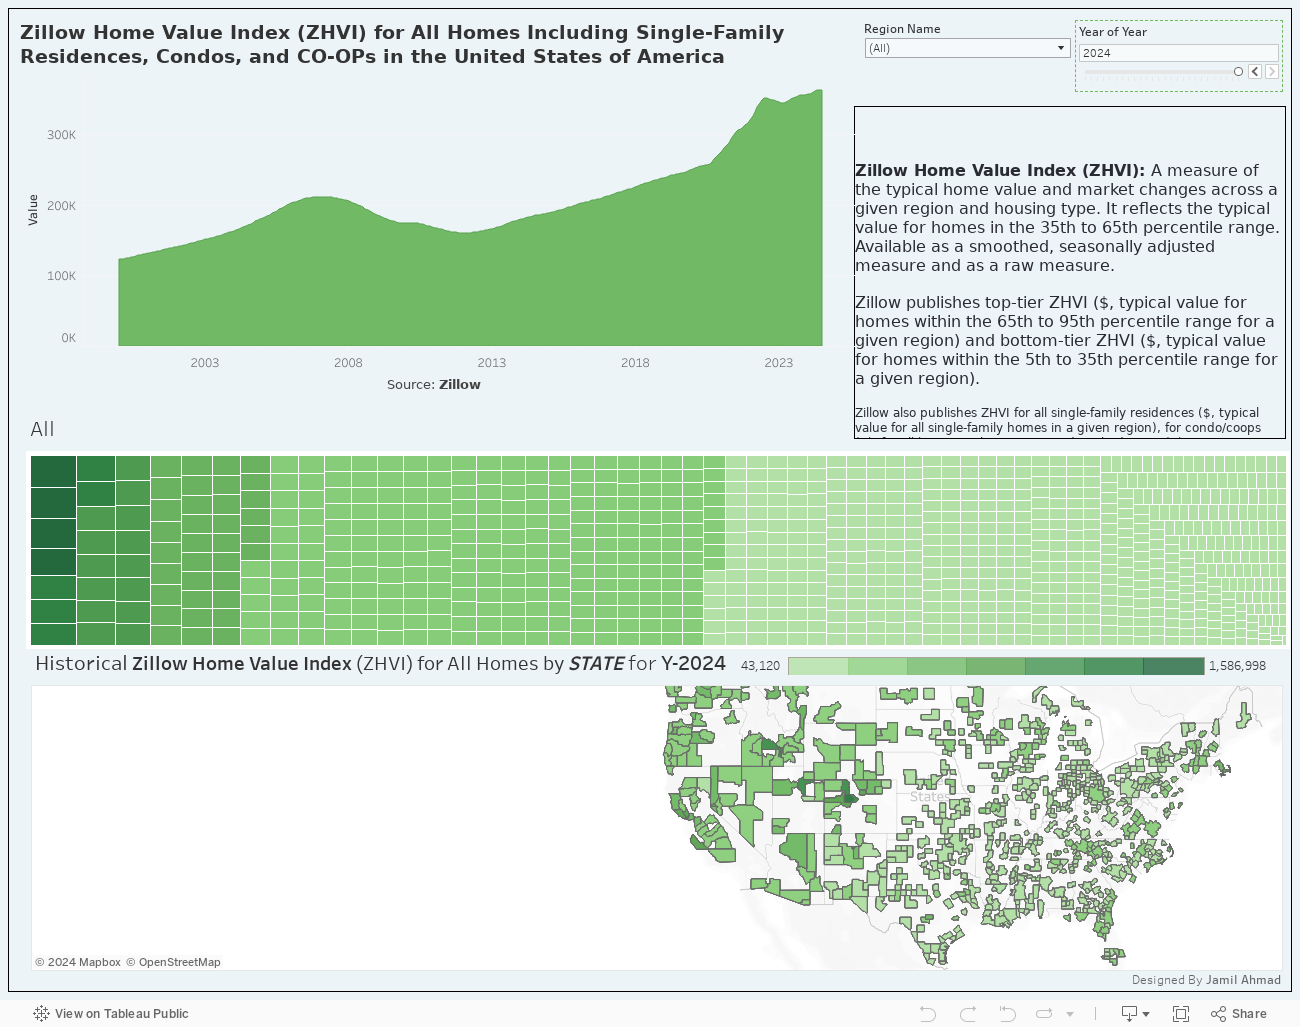
- Zillow Home Value Index (ZHVI): A smoothed, seasonally adjusted measure of the typical home value across different geographies and property types.
- Zillow Rent Index (ZRI): Tracks the monthly median rent for various property types.
- Sales Counts: Data on the number of properties sold within a specific time frame and location.
- Inventory: Data on the number of homes available for sale.
Step 2: Downloading the Dataset
Navigate to the Zillow Research Data portal and download the relevant dataset. For identifying price trends, you might want to start with the Zillow Home Value Index (ZHVI) dataset, as it provides historical home values at various geographic levels (e.g., city, state, zip code).
Steps:
- Visit Zillow Research Data.
- Select the “Home Values” section.
- Choose the ZHVI dataset relevant to your area of interest (e.g., by state, metro, or city).
- Download the dataset in CSV format.
Step 3: Analyzing the Data
Once you have the data, you can begin analyzing it to identify price trends. Here are some key steps:
- Data Cleaning: Ensure that the data is clean and structured. Remove any null values and ensure consistency in the date format.
- Time Series Analysis: Conduct a time series analysis to observe how home values have changed over time. This can be done by plotting the data and observing the trend lines.
- Seasonality: Look for seasonal patterns in the data. Real estate markets often exhibit seasonality, with prices rising or falling during certain times of the year.
- Geographic Analysis: Compare trends across different geographic locations. This can help identify which areas are experiencing the fastest growth.
Step 4: Visualizing the Trends
Visualization is key to understanding and communicating your findings. Use tools like Tableau, Power BI, or Python libraries like Matplotlib and Seaborn to create visual representations of the data. Some useful visualizations include:
- Line Charts: To show how prices have changed over time.
- Heat Maps: To show geographic variations in home values.
- Bar Charts: To compare price changes across different property types or regions.
Conclusion
By following these steps, you can effectively use Zillow data to identify real estate price trends. Whether you’re a real estate investor, a data analyst, or just curious about the market, this analysis can provide valuable insights into how property values are evolving.
Next Steps
- Download the ZHVI dataset from Zillow and start your analysis.
- Experiment with different visualization techniques to uncover unique insights.
- Consider diving deeper into related datasets, such as rent prices and sales counts, to complement your analysis.
By harnessing the power of Zillow’s extensive data, you can gain a comprehensive understanding of real estate price trends and make informed decisions in the market.
Note: Calculate your loan payments and view your personalized amortization schedule using our easy-to-use Loan Amortization Schedule Calculator
Leave a Reply to benefits of ginseng root for men over 40 Cancel reply