Datatipss.Com

Datatipss.Com

  • Blog
  • Economics
  • Power BI Tips
  • Privacy Policy
  • Contact
  • About

Tag: data Interpretation

  • 13
    Dec
    Blog, Business, Dashboard, Data Analysis, Economics

    Jamil Ahmad

    Freelance Forward 2023

    Freelance Forward 2023

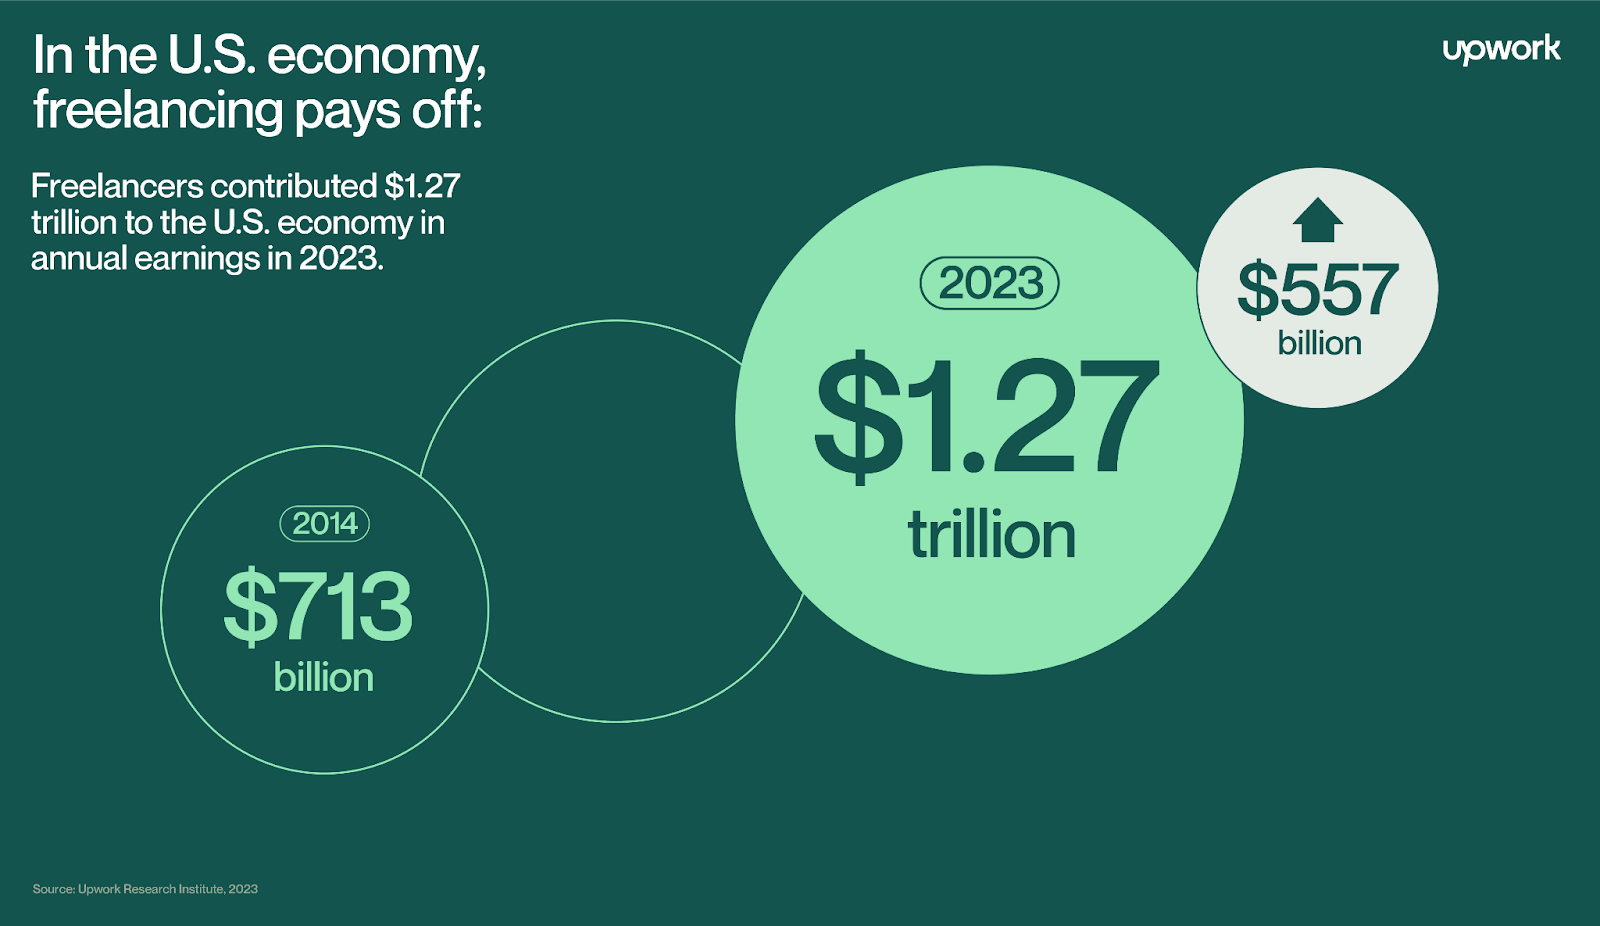
    Introduction:The Freelance Forward 2023 survey by the Upwork Research Institute unveils a dynamic shift in the U.S. workforce, showcasing the enduring significance of freelancing amid changing economic conditions, a global pandemic, and technological advancements. The study, based on a representative sample of 3,000 professionals, offers key insights into the growing impact of freelancing on both…

    Continue Reading

  • 19
    Sep
    Data Analysis, Excel

    Jamil Ahmad

    How to Display Negative Values with Parentheses

    How to Display Negative Values with Parentheses

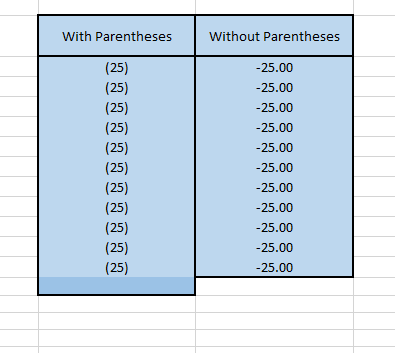
    Custom Cell Format in Excel: How to Display Negative Values with Parentheses   Excel is a powerful tool for managing and presenting data, and one of its lesser-known features is the ability to customize cell formats. In this blog post, we’ll dive into the custom cell format “#,##0.00;(#,##0.00)” and explore how it can be used…

    Continue Reading

  • 19
    Sep
    Blog, Data Analysis

    Jamil Ahmad

    Streamlining Data Analysis and Reporting: A Guide with Excel and Python

    Streamlining Data Analysis and Reporting: A Guide with Excel and Python

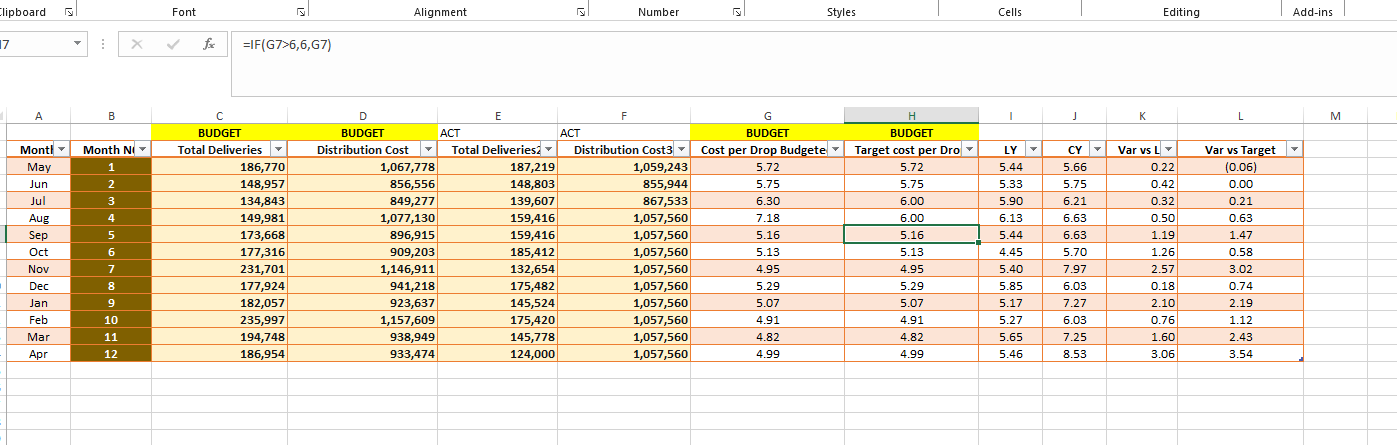
    In today’s data-driven world, businesses are constantly seeking ways to streamline their data analysis and reporting processes. Whether you’re a spreadsheet whiz with Excel or a Python enthusiast, there are efficient ways to automate these tasks. In this guide, we’ll show you how to harness the power of both Excel and Python to make your…

    Continue Reading

  • 8
    Sep
    Blog, Data Analysis, Excel

    Jamil Ahmad

    A Beginner’s Guide to Data Analysis with Excel

    Are you ready to dive into the world of data analysis? Excel, the trusted spreadsheet tool, is your perfect starting point. In this beginner’s guide, we’ll take you on a data-driven journey, demystifying the art of data analysis with simple steps and a friendly approach Step 1: Getting Acquainted Let’s begin with the basics. Open…

    Continue Reading

Previous Page
1 2

Search

About

Data Analyst with over 4 years of experience creating interactive dashboards, visual reports, and insights using Power BI, Excel, and Python. I help businesses make smarter decisions by turning raw data into clear, actionable insights.

Archive

  • July 2025
  • December 2024
  • September 2024
  • June 2024
  • May 2024
  • April 2024
  • March 2024
  • February 2024
  • January 2024
  • December 2023
  • November 2023
  • October 2023
  • September 2023

Categories

  • Advertising
  • Blog
  • Business
  • Dashboard
  • Data Analysis
  • Design
  • Digital
  • Economics
  • Excel
  • Film
  • Photography
  • Real Estate Data Analysis
  • Zillow

Recent Posts

  • How to Plan a Dashboard as a Business Owner: A Step-by-Step Guide30 July 2025
  • How to Connect JotForm with Power BI for Responses Visualization 202527 December 2024
  • UAE: A Country Living 50 Years Ahead18 December 2024
  • How I Achieved “Data Analysis with Python” by IBM on Coursera17 December 2024
  • How to Identify Price Trends Using Zillow 2024
    How to Identify Price Trends Using Zillow 202510 December 2024

Social Icons

  • Facebook
  • Instagram
  • LinkedIn
  • Twitter
  • WhatsApp

Datatipss.Com

Offers expert Power BI dashboards and data analysis services to transform your data into smart business decisions.

  • Twitter
  • Facebook
  • Instagram
  • WordPress

Quick Links

  • Home
  • About
  • Schedule
  • Blog
  • Contact

Get In Touch

jamilqpr@gmail.com

+923056645202

Mon – Fri 8:00 AM to 5:00 PM SUNDAY – CLOSED

Datatipss.com All Rights Reserved

.