Tag: matplotlib

How I Achieved “Data Analysis with Python” by IBM on Coursera
Hello! My name is Jamil Ahmad, and I am a freelance Data Analyst with a Master’s degree in Economics, living in Pakistan. Over the past few years, I have worked on Upwork as a Top-Rated freelancer, helping clients worldwide with data analysis and visualization. Today, I want to share my journey of completing the prestigious…

Insights from Superstore’s Sales and Profitability
Welcome to the Diverse World of Data: A Deep Dive into Superstore’s Sales and Profitability with Visual Insights In the bustling marketplace of today’s retail world, data tells a story, a narrative of numbers that reveals the secrets behind sales and profits. Our journey today takes us through the extensive dataset of a superstore, exploring…

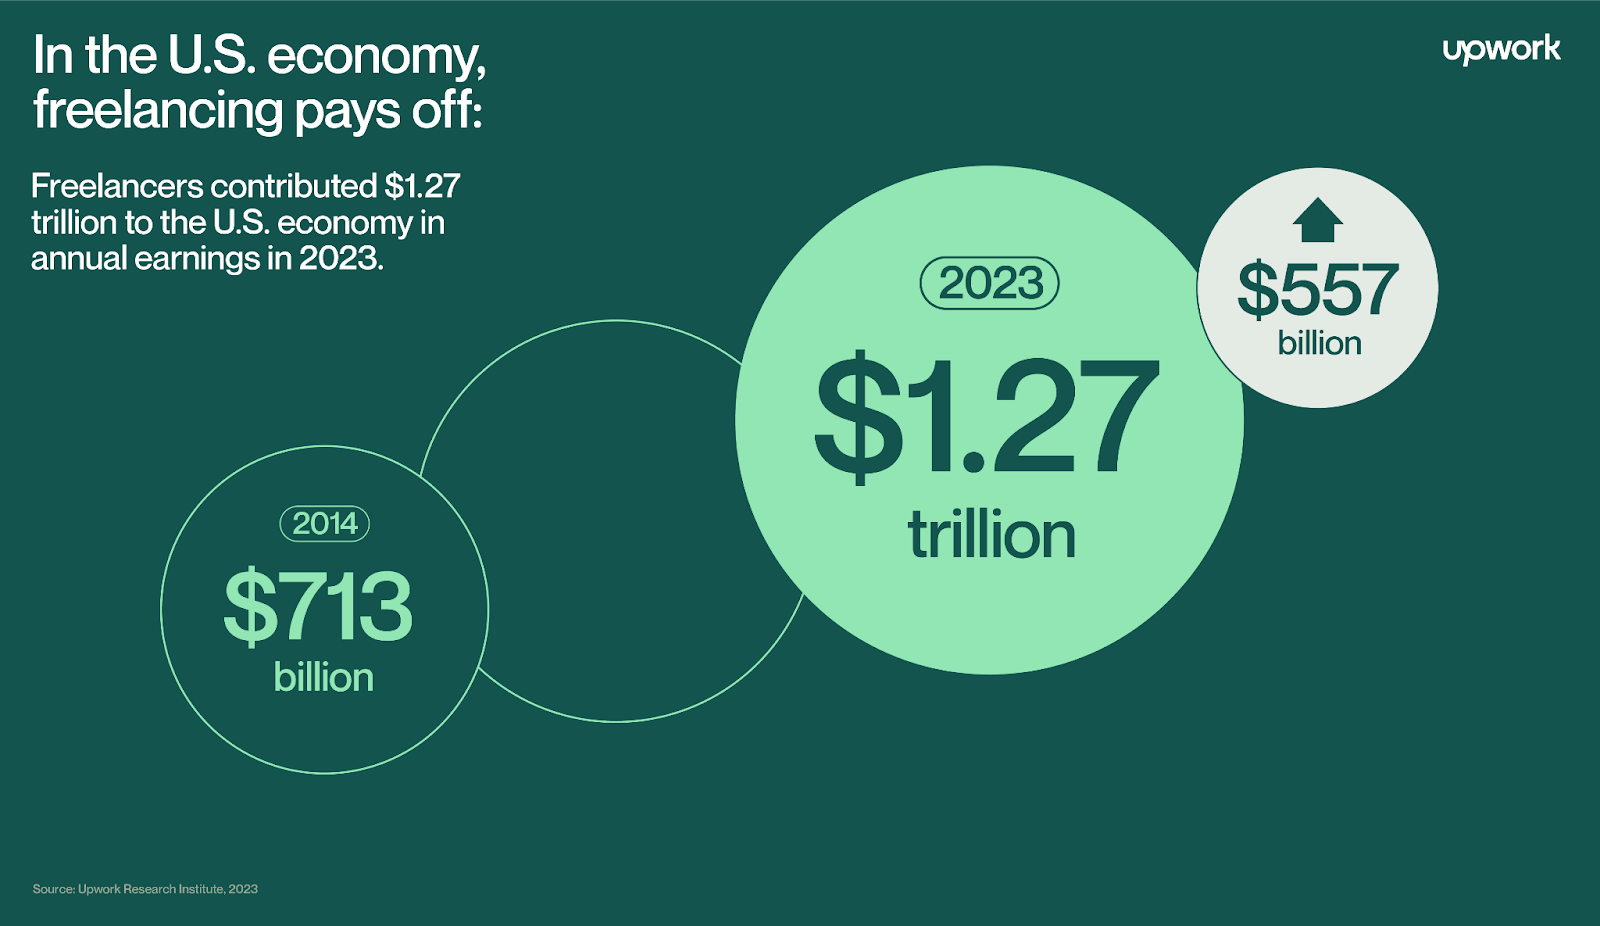
Freelance Forward 2023
Introduction:The Freelance Forward 2023 survey by the Upwork Research Institute unveils a dynamic shift in the U.S. workforce, showcasing the enduring significance of freelancing amid changing economic conditions, a global pandemic, and technological advancements. The study, based on a representative sample of 3,000 professionals, offers key insights into the growing impact of freelancing on both…

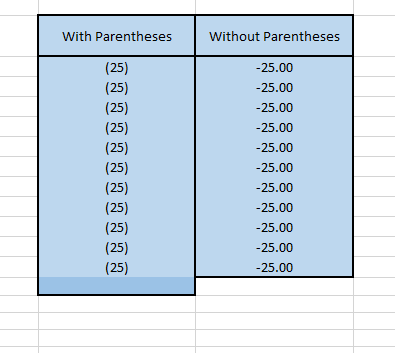
How to Display Negative Values with Parentheses
Custom Cell Format in Excel: How to Display Negative Values with Parentheses Excel is a powerful tool for managing and presenting data, and one of its lesser-known features is the ability to customize cell formats. In this blog post, we’ll dive into the custom cell format “#,##0.00;(#,##0.00)” and explore how it can be used…

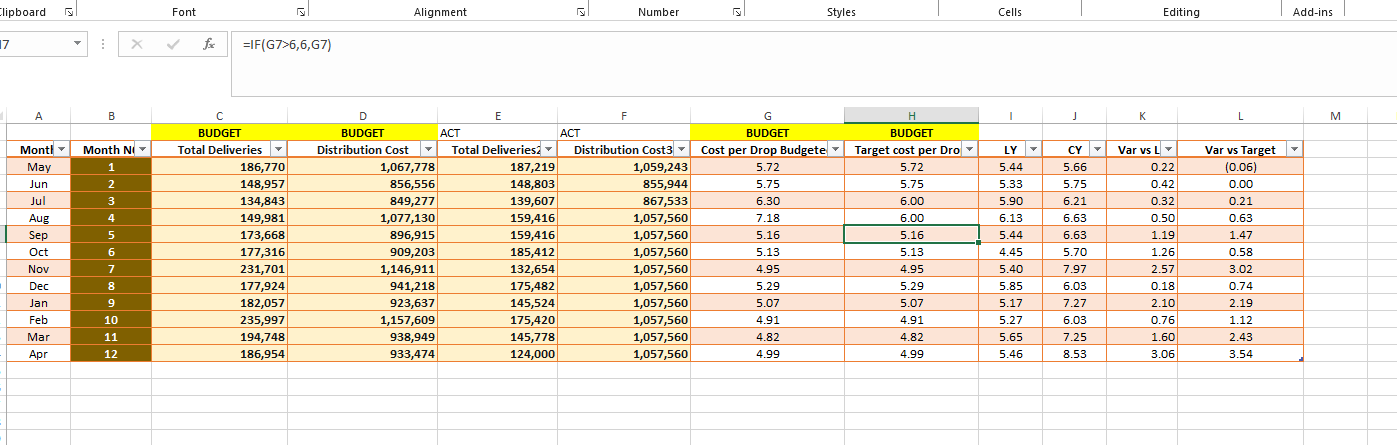
Streamlining Data Analysis and Reporting: A Guide with Excel and Python
In today’s data-driven world, businesses are constantly seeking ways to streamline their data analysis and reporting processes. Whether you’re a spreadsheet whiz with Excel or a Python enthusiast, there are efficient ways to automate these tasks. In this guide, we’ll show you how to harness the power of both Excel and Python to make your…