Tag: excel data analysis

How to Connect JotForm with Power BI for Responses Visualization 2025
IntroductionHello! I’m Jamil Ahmad, a Business Intelligence (BI) consultant from Pakistan, working with clients worldwide via Upwork. If you’re looking for a way to seamlessly connect JotForm submissions to Power BI and visualize your survey responses, you’re in the right place! This guide will show you step-by-step methods to make your data speak through stunning…
Insights from Healthcare Data: Trends, Patterns, and Demographic Analysis Case Study
Introduction to Healthcare Dataset Analysis Case Study 001 Welcome to this comprehensive guide on analyzing a synthetic healthcare dataset. This dataset has been meticulously crafted to simulate real-world healthcare data, making it an invaluable resource for data science, machine learning, and data analysis enthusiasts. Whether you are a seasoned professional or a budding analyst, this…
How to Create a Demand and Supply Chart in Excel
Demand Curve in Excel Supply Curve in Excel Description of the Chart: The demand and supply chart illustrates the relationship between the price of a product or service and the quantity demanded and supplied in a market. In this chart, the demand curve represents the quantity of a good or service that consumers are willing…
Simplify Your Invoicing Process with Our Excel Invoice Template and VBA Automation
Are you looking for a seamless solution to generate and save invoices effortlessly? Our Excel invoice template, coupled with VBA automation, offers just that! Say goodbye to manual processes and hello to efficiency with our streamlined invoicing system. Why Choose Our Excel Invoice Template with VBA Automation? Our solution combines the flexibility of Excel with…

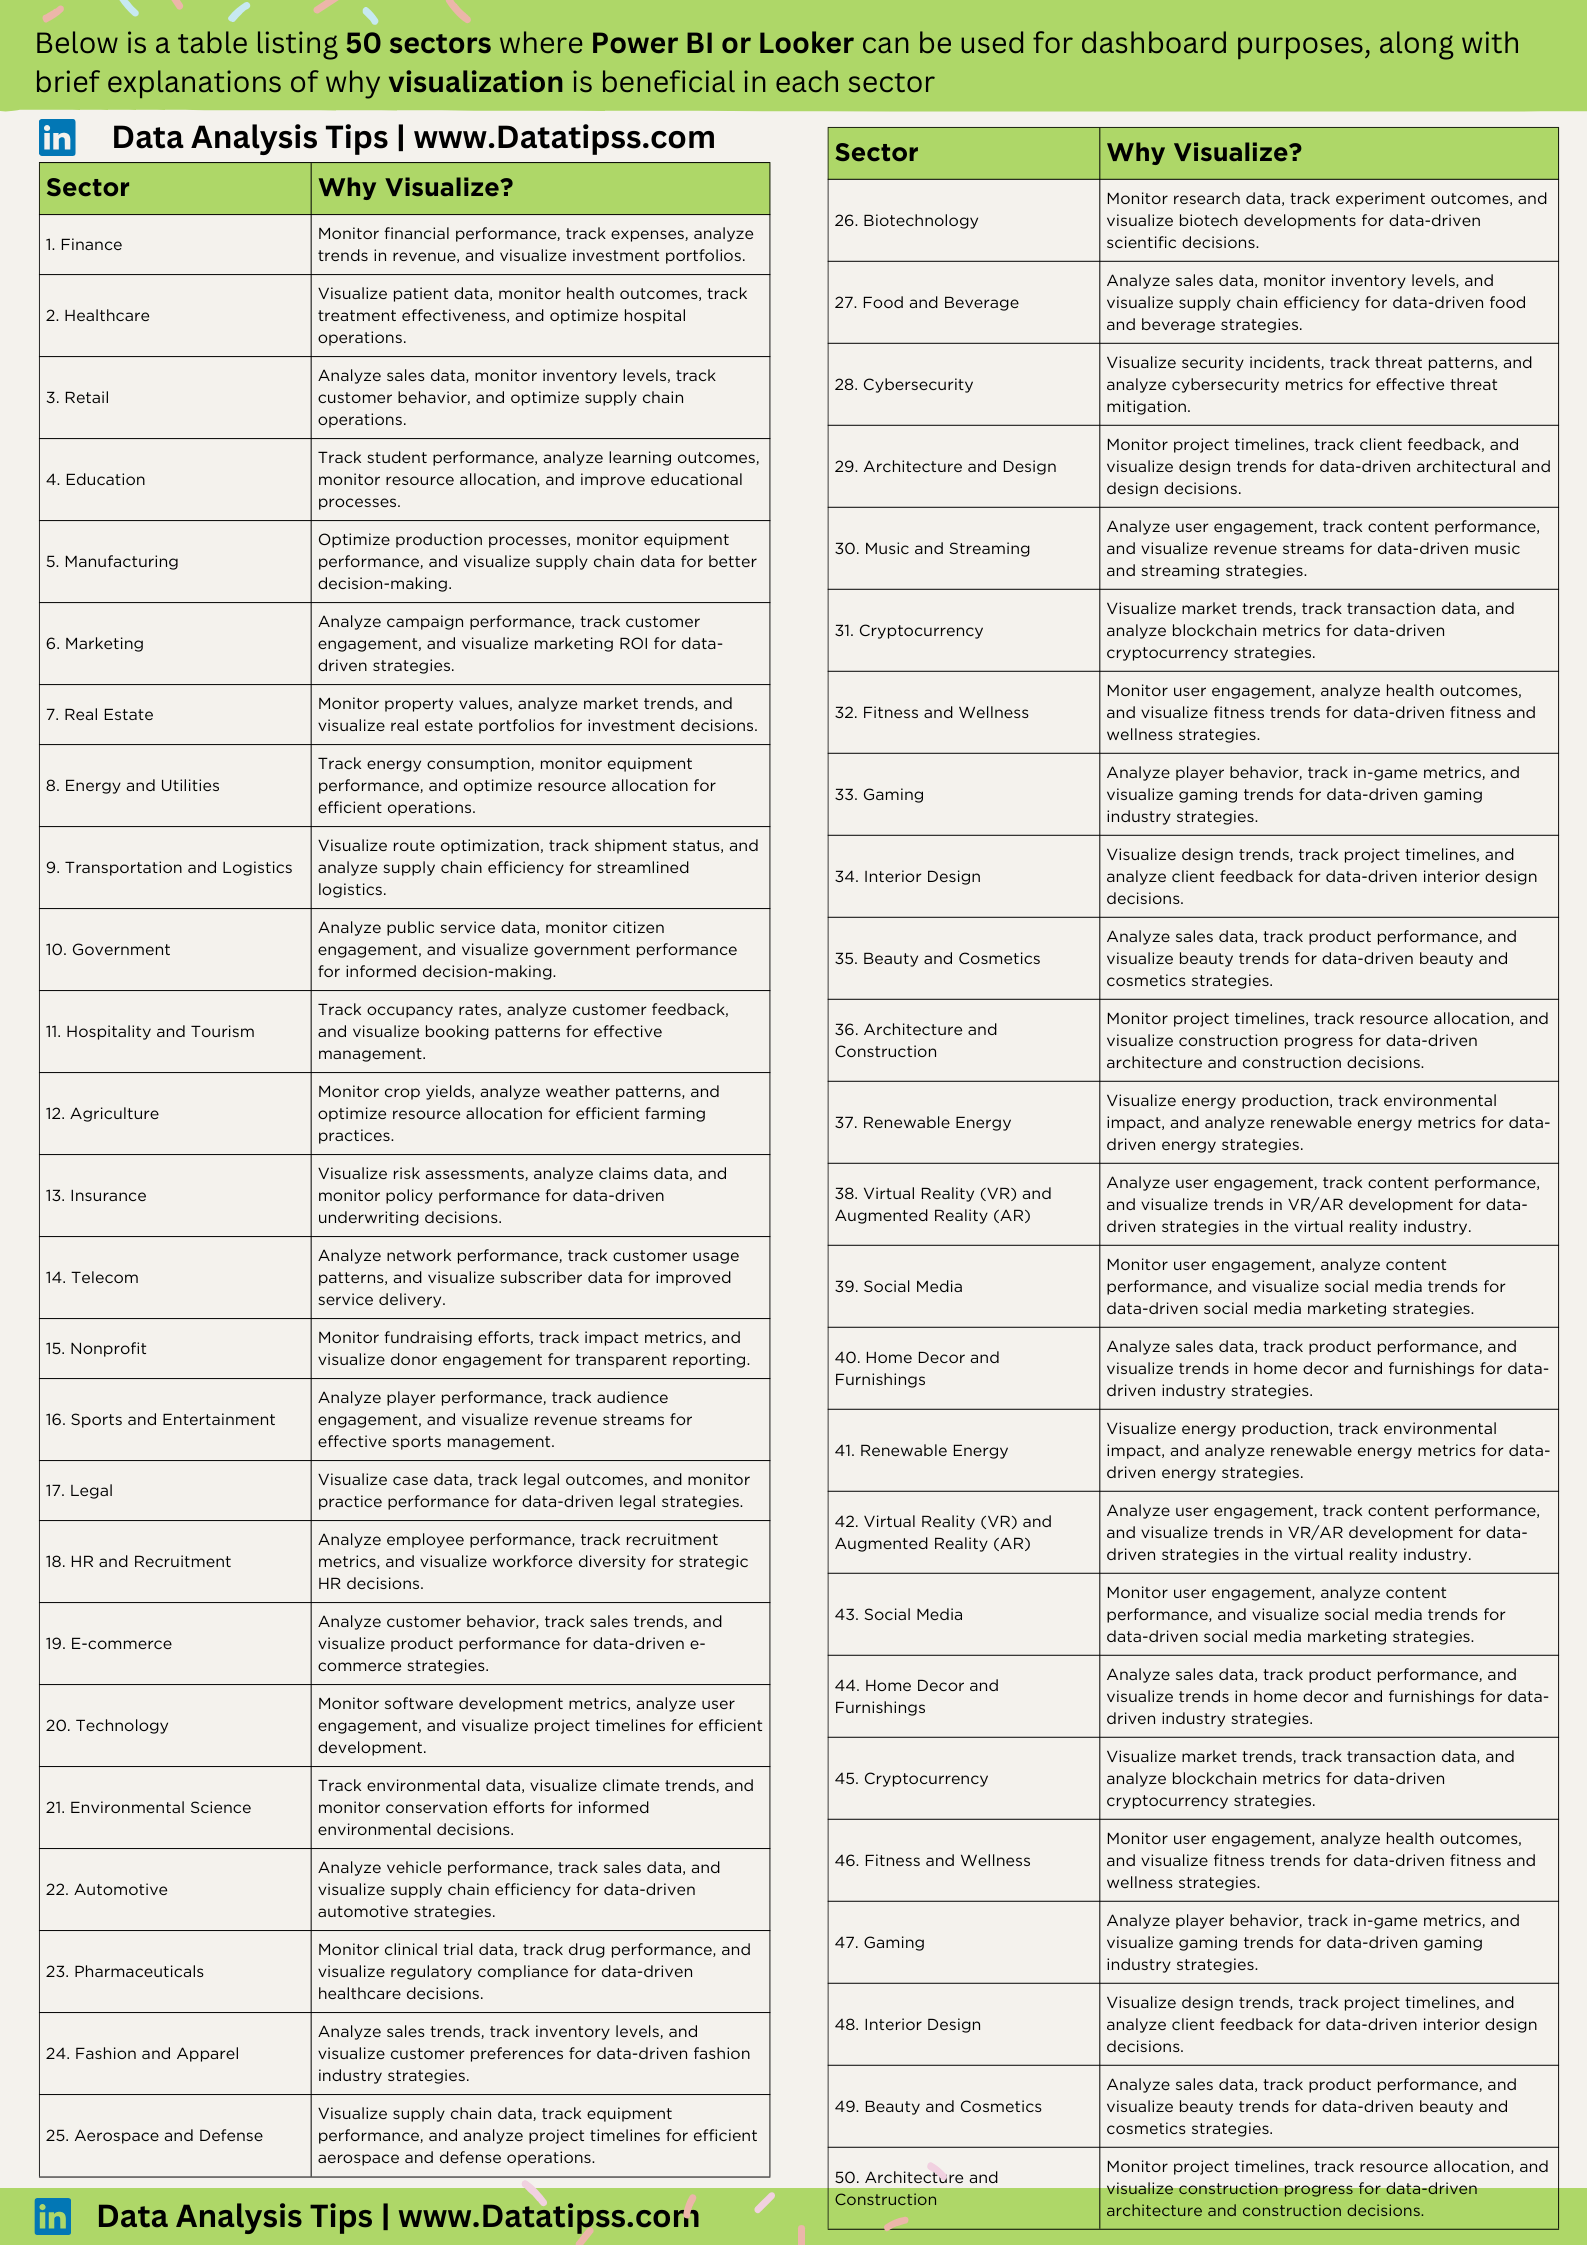
Unlocking Insights: Data Visualization Across 50 Sectors
In the dynamic landscape of data analytics, the power of visualization cannot be overstated. The ability to transform raw data into compelling visuals not only enhances understanding but also drives informed decision-making across diverse industries. In this blog post, we explore the vast applications of data visualization using powerful tools like Power BI and Looker,…

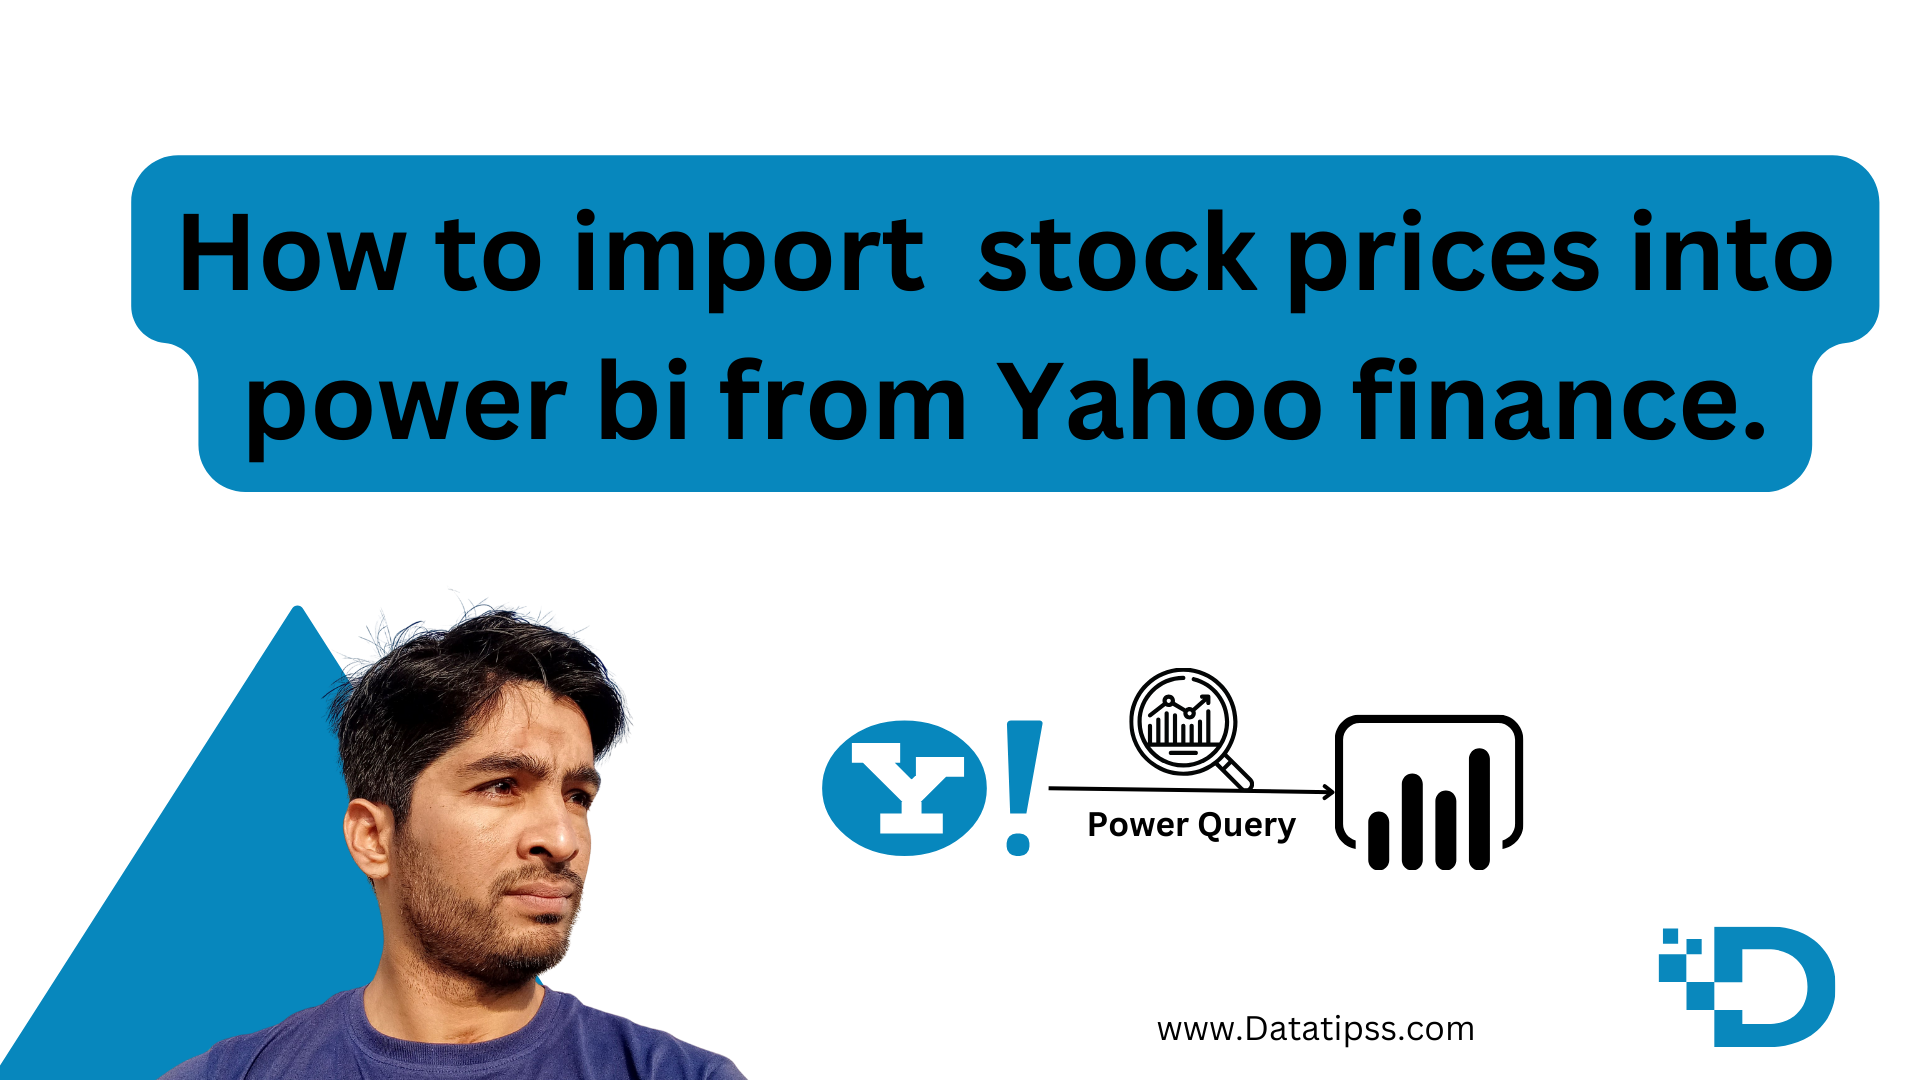
Fetching Stock Prices from Yahoo Finance using Power Query in Power BI 2024
Are you keen on tracking historical stock prices in Power BI? Leverage the power of Power Query to seamlessly fetch and analyze stock prices from Yahoo Finance. This blog post will guide you through a step-by-step process, providing a convenient Power Query code snippet that you can integrate directly into your Power BI reports. Fetching…

Insights from Superstore’s Sales and Profitability
Welcome to the Diverse World of Data: A Deep Dive into Superstore’s Sales and Profitability with Visual Insights In the bustling marketplace of today’s retail world, data tells a story, a narrative of numbers that reveals the secrets behind sales and profits. Our journey today takes us through the extensive dataset of a superstore, exploring…

Mastering SQL for Data Analysis: 50+ Essential Questions Answered
Mastering SQL for Data Analysis: 50+ Essential Questions Answered Welcome to our comprehensive guide designed for data enthusiasts, analysts, scientists, and anyone passionate about data! We’ve curated over 50 SQL questions specifically tailored for data analysis, covering everything from basic operations to complex analytical techniques. Whether you’re preparing for an interview, enhancing your skills, or…

Data Analysis Strategies for Consistency and Success in 2024
Certainly, here are 10 pieces of advice for data analysts in 2024 to help them stay consistent and successful in their work: Stay Updated: Continuously update your skills and knowledge in data analysis. Follow industry trends, read blogs, and attend relevant conferences to stay current with the latest tools and techniques. In 2024, the world…

Top 10 Data Analysis Tools for 2024
Welcome to DataTipss.com, where we dive into the latest and greatest tools revolutionizing the world of data analysis. As we step into 2024, it’s clear that the landscape is rapidly evolving, with innovative software making data more accessible and insights more actionable. Whether you’re a seasoned data analyst or just starting, this list of the…