
In the dynamic landscape of data analytics, the power of visualization cannot be overstated. The ability to transform raw data into compelling visuals not only enhances understanding but also drives informed decision-making across diverse industries. In this blog post, we explore the vast applications of data visualization using powerful tools like Power BI and Looker, highlighting their impact on 50 different sectors.
The Power of Visualization
Data visualization is the art of representing complex datasets in a visual format, making it easier to identify patterns, trends, and outliers. It goes beyond mere aesthetics; it’s about turning numbers into actionable insights. The visual representation of data enables stakeholders to grasp information quickly and draw meaningful conclusions.
Sectors Transformed by Visualization
Let’s delve into the myriad sectors where data visualization, facilitated by tools like Power BI and Looker, is making waves:
1. Finance
Visualizing financial data helps monitor performance, track expenses, and analyze investment portfolios.
2. Healthcare
In the healthcare sector, visualization aids in tracking patient data, monitoring health outcomes, and optimizing hospital operations.
3. Retail
For the retail industry, data visualization is essential to analyze sales data, track customer behavior, and optimize supply chain operations.
And the list goes on, covering 47 more sectors!
Exploring the Table
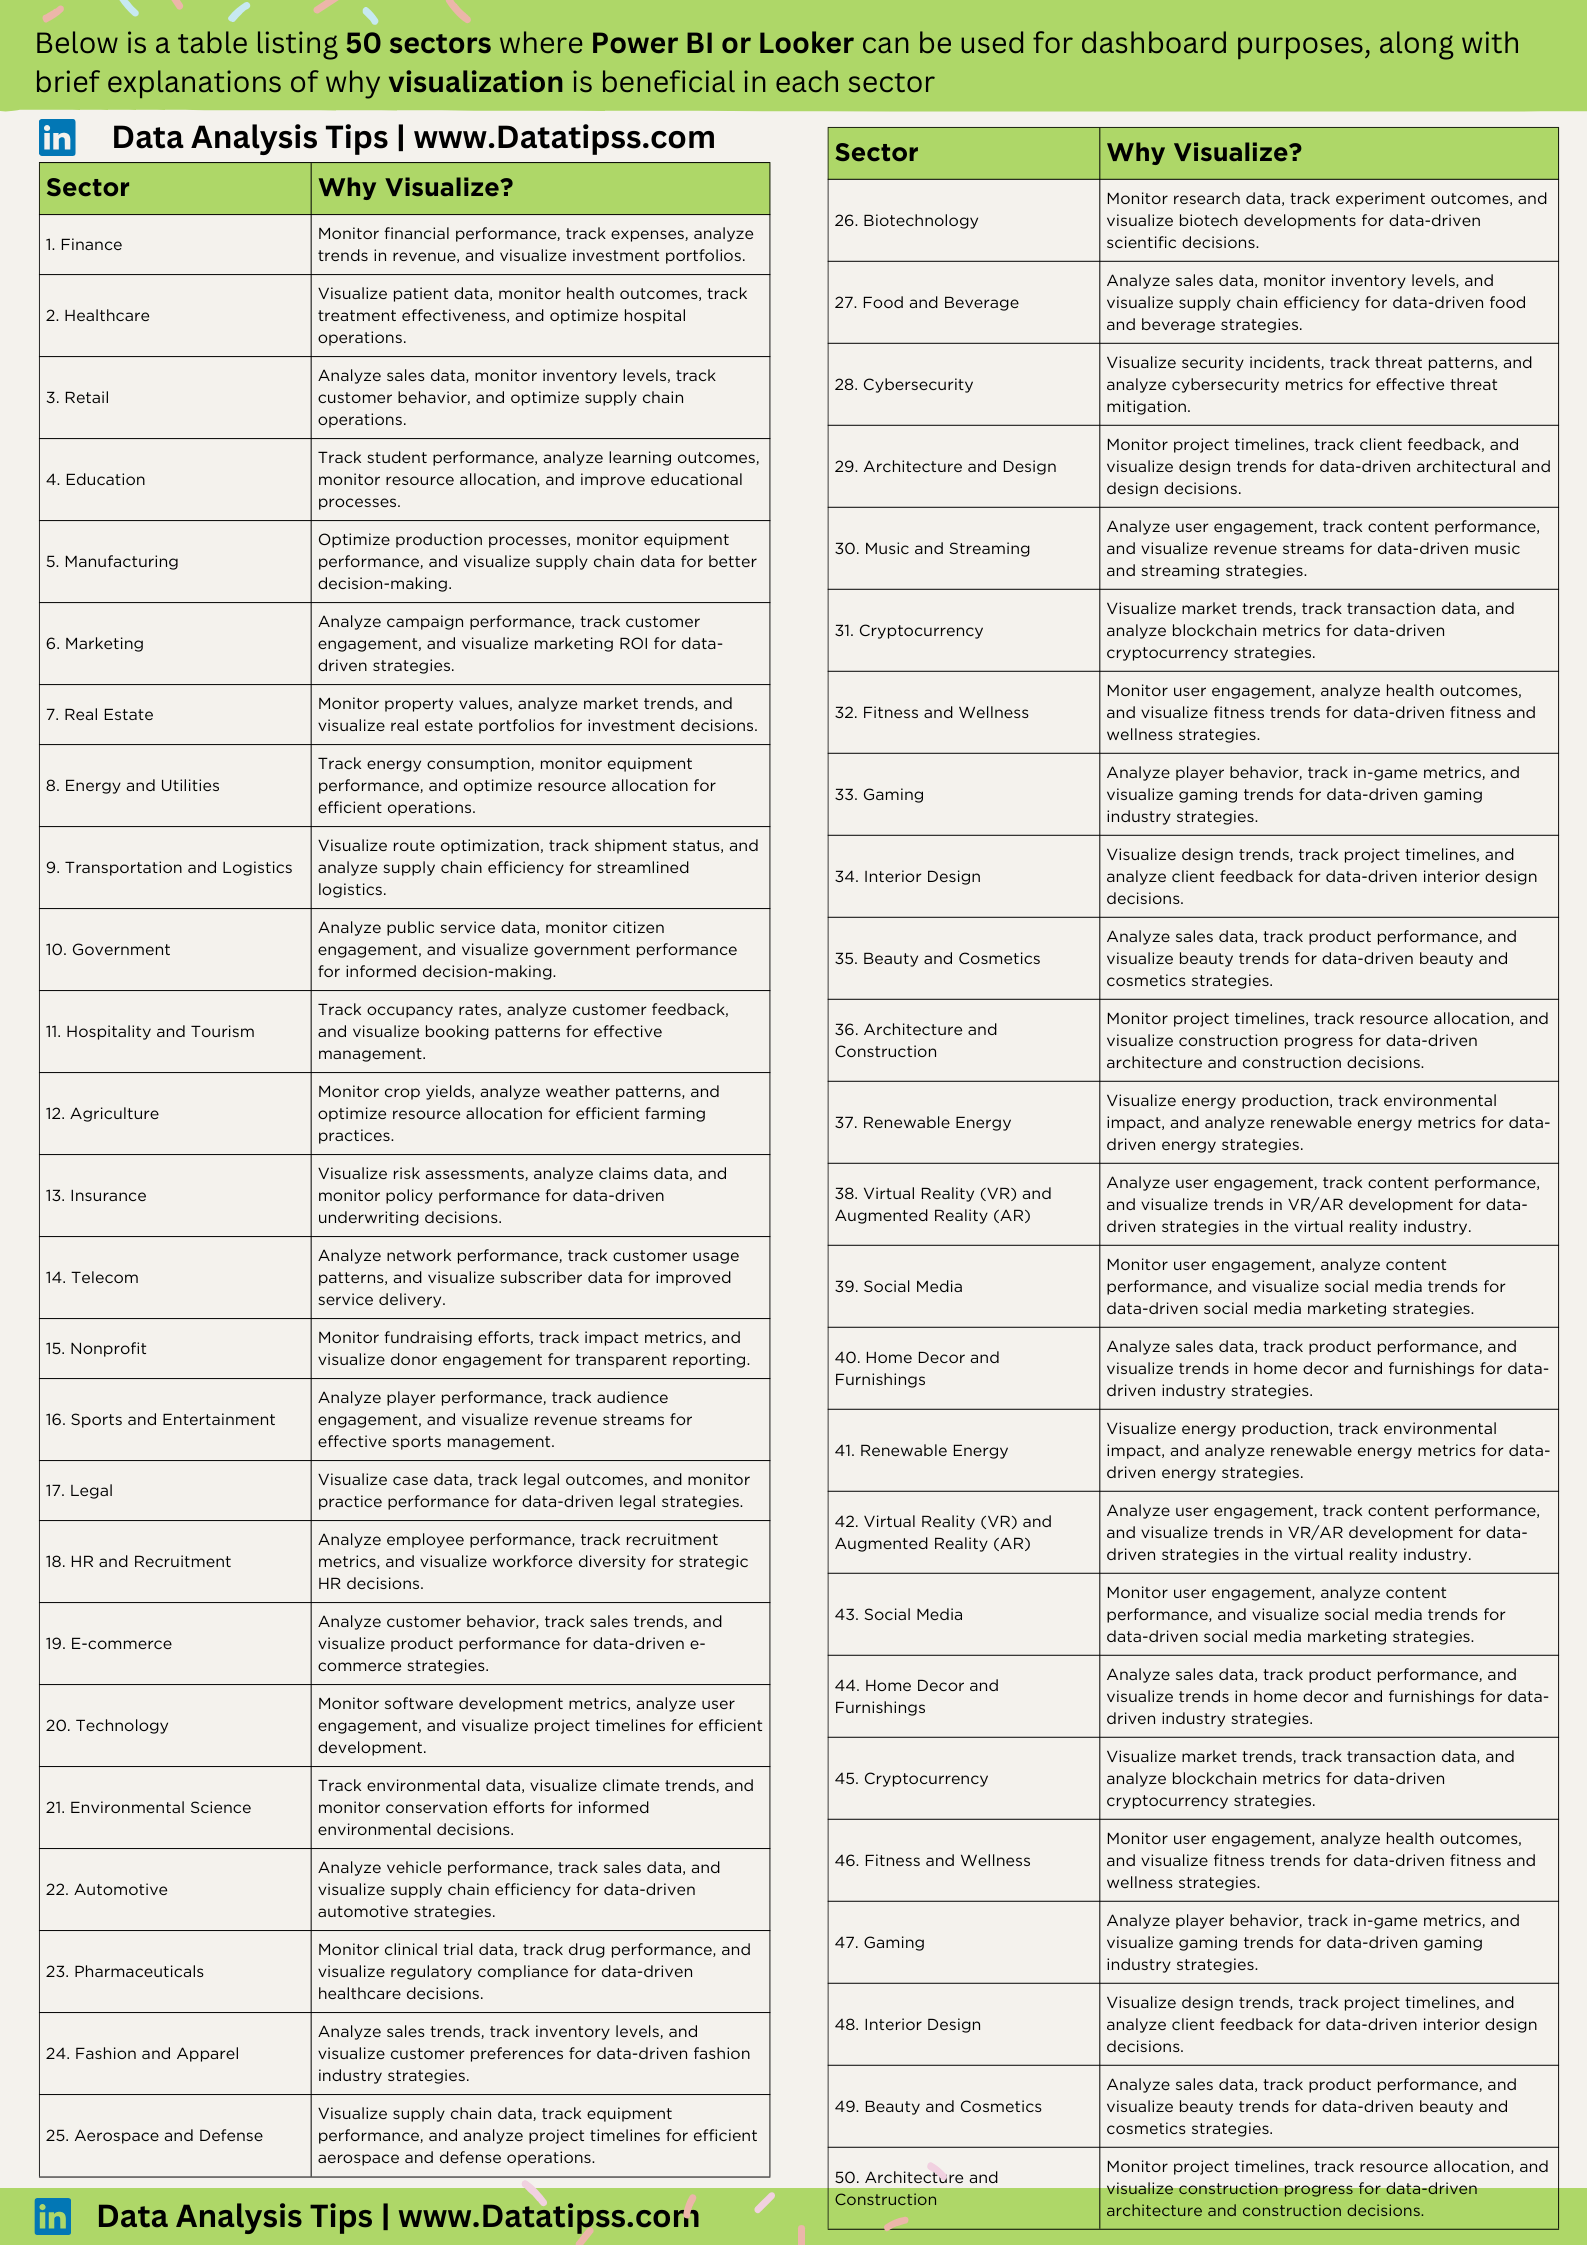
The table below provides a snapshot of the sectors and a brief explanation of why visualization is crucial in each domain. From Finance to Renewable Energy, each sector benefits from the power of visual analytics.
| Sector | Why Visualize? |
|---|---|
| 1. Finance | Monitor financial performance, track expenses, analyze trends in revenue, and visualize investment portfolios. |
| 2. Healthcare | Visualize patient data, monitor health outcomes, track treatment effectiveness, and optimize hospital operations. |
| 3. Retail | Analyze sales data, monitor inventory levels, track customer behavior, and optimize supply chain operations. |
| 4. Education | Track student performance, analyze learning outcomes, monitor resource allocation, and improve educational processes. |
| 5. Manufacturing | Optimize production processes, monitor equipment performance, and visualize supply chain data for better decision-making. |
| 6. Marketing | Analyze campaign performance, track customer engagement, and visualize marketing ROI for data-driven strategies. |
| 7. Real Estate | Monitor property values, analyze market trends, and visualize real estate portfolios for investment decisions. |
| 8. Energy and Utilities | Track energy consumption, monitor equipment performance, and optimize resource allocation for efficient operations. |
| 9. Transportation and Logistics | Visualize route optimization, track shipment status, and analyze supply chain efficiency for streamlined logistics. |
| 10. Government | Analyze public service data, monitor citizen engagement, and visualize government performance for informed decision-making. |
| 11. Hospitality and Tourism | Track occupancy rates, analyze customer feedback, and visualize booking patterns for effective management. |
| 12. Agriculture | Monitor crop yields, analyze weather patterns, and optimize resource allocation for efficient farming practices. |
| 13. Insurance | Visualize risk assessments, analyze claims data, and monitor policy performance for data-driven underwriting decisions. |
| 14. Telecom | Analyze network performance, track customer usage patterns, and visualize subscriber data for improved service delivery. |
| 15. Nonprofit | Monitor fundraising efforts, track impact metrics, and visualize donor engagement for transparent reporting. |
| 16. Sports and Entertainment | Analyze player performance, track audience engagement, and visualize revenue streams for effective sports management. |
| 17. Legal | Visualize case data, track legal outcomes, and monitor practice performance for data-driven legal strategies. |
| 18. HR and Recruitment | Analyze employee performance, track recruitment metrics, and visualize workforce diversity for strategic HR decisions. |
| 19. E-commerce | Analyze customer behavior, track sales trends, and visualize product performance for data-driven e-commerce strategies. |
| 20. Technology | Monitor software development metrics, analyze user engagement, and visualize project timelines for efficient development. |
| 21. Environmental Science | Track environmental data, visualize climate trends, and monitor conservation efforts for informed environmental decisions. |
| 22. Automotive | Analyze vehicle performance, track sales data, and visualize supply chain efficiency for data-driven automotive strategies. |
| 23. Pharmaceuticals | Monitor clinical trial data, track drug performance, and visualize regulatory compliance for data-driven healthcare decisions. |
| 24. Fashion and Apparel | Analyze sales trends, track inventory levels, and visualize customer preferences for data-driven fashion industry strategies. |
| 25. Aerospace and Defense | Visualize supply chain data, track equipment performance, and analyze project timelines for efficient aerospace and defense operations. |
| 26. Biotechnology | Monitor research data, track experiment outcomes, and visualize biotech developments for data-driven scientific decisions. |
| 27. Food and Beverage | Analyze sales data, monitor inventory levels, and visualize supply chain efficiency for data-driven food and beverage strategies. |
| 28. Cybersecurity | Visualize security incidents, track threat patterns, and analyze cybersecurity metrics for effective threat mitigation. |
| 29. Architecture and Design | Monitor project timelines, track client feedback, and visualize design trends for data-driven architectural and design decisions. |
| 30. Music and Streaming | Analyze user engagement, track content performance, and visualize revenue streams for data-driven music and streaming strategies. |
| 31. Cryptocurrency | Visualize market trends, track transaction data, and analyze blockchain metrics for data-driven cryptocurrency strategies. |
| 32. Fitness and Wellness | Monitor user engagement, analyze health outcomes, and visualize fitness trends for data-driven fitness and wellness strategies. |
| 33. Gaming | Analyze player behavior, track in-game metrics, and visualize gaming trends for data-driven gaming industry strategies. |
| 34. Interior Design | Visualize design trends, track project timelines, and analyze client feedback for data-driven interior design decisions. |
| 35. Beauty and Cosmetics | Analyze sales data, track product performance, and visualize beauty trends for data-driven beauty and cosmetics strategies. |
| 36. Architecture and Construction | Monitor project timelines, track resource allocation, and visualize construction progress for data-driven architecture and construction decisions. |
| 37. Renewable Energy | Visualize energy production, track environmental impact, and analyze renewable energy metrics for data-driven energy strategies. |
| 38. Virtual Reality (VR) and Augmented Reality (AR) | Analyze user engagement, track content performance, and visualize trends in VR/AR development for data-driven strategies in the virtual reality industry. |
| 39. Social Media | Monitor user engagement, analyze content performance, and visualize social media trends for data-driven social media marketing strategies. |
| 40. Home Decor and Furnishings | Analyze sales data, track product performance, and visualize trends in home decor and furnishings for data-driven industry strategies. |
| 41. Renewable Energy | Visualize energy production, track environmental impact, and analyze renewable energy metrics for data-driven energy strategies. |
| 42. Virtual Reality (VR) and Augmented Reality (AR) | Analyze user engagement, track content performance, and visualize trends in VR/AR development for data-driven strategies in the virtual reality industry. |
| 43. Social Media | Monitor user engagement, analyze content performance, and visualize social media trends for data-driven social media marketing strategies. |
| 44. Home Decor and Furnishings | Analyze sales data, track product performance, and visualize trends in home decor and furnishings for data-driven industry strategies. |
| 45. Cryptocurrency | Visualize market trends, track transaction data, and analyze blockchain metrics for data-driven cryptocurrency strategies. |
| 46. Fitness and Wellness | Monitor user engagement, analyze health outcomes, and visualize fitness trends for data-driven fitness and wellness strategies. |
| 47. Gaming | Analyze player behavior, track in-game metrics, and visualize gaming trends for data-driven gaming industry strategies. |
| 48. Interior Design | Visualize design trends, track project timelines, and analyze client feedback for data-driven interior design decisions. |
| 49. Beauty and Cosmetics | Analyze sales data, track product performance, and visualize beauty trends for data-driven beauty and cosmetics strategies. |
| 50. Architecture and Construction | Monitor project timelines, track resource allocation, and visualize construction progress for data-driven architecture and construction decisions. |
Why Does Visualization Matter?
- Actionable Insights: Visualization turns complex data into actionable insights, guiding decision-makers in their strategies.
- Effective Communication: Visuals are universally understood, making it easier to communicate findings across different teams and stakeholders.
- Pattern Recognition: Visualization highlights patterns and trends that may not be immediately apparent in raw data.
Bringing it All Together
Data visualization is a game-changer in the world of data analytics. By presenting information visually, it becomes accessible, interpretable, and actionable. Whether you’re in Finance, Healthcare, or any other sector, harnessing the power of tools like Power BI and Looker can transform your approach to data-driven decision-making.
Are you curious about how data visualization can revolutionize your industry? Explore the table above, find your sector, and discover the possibilities.
Ready to visualize success? Let’s dive in together!

Leave a Reply to Barrybatag Cancel reply